
Figure 2.
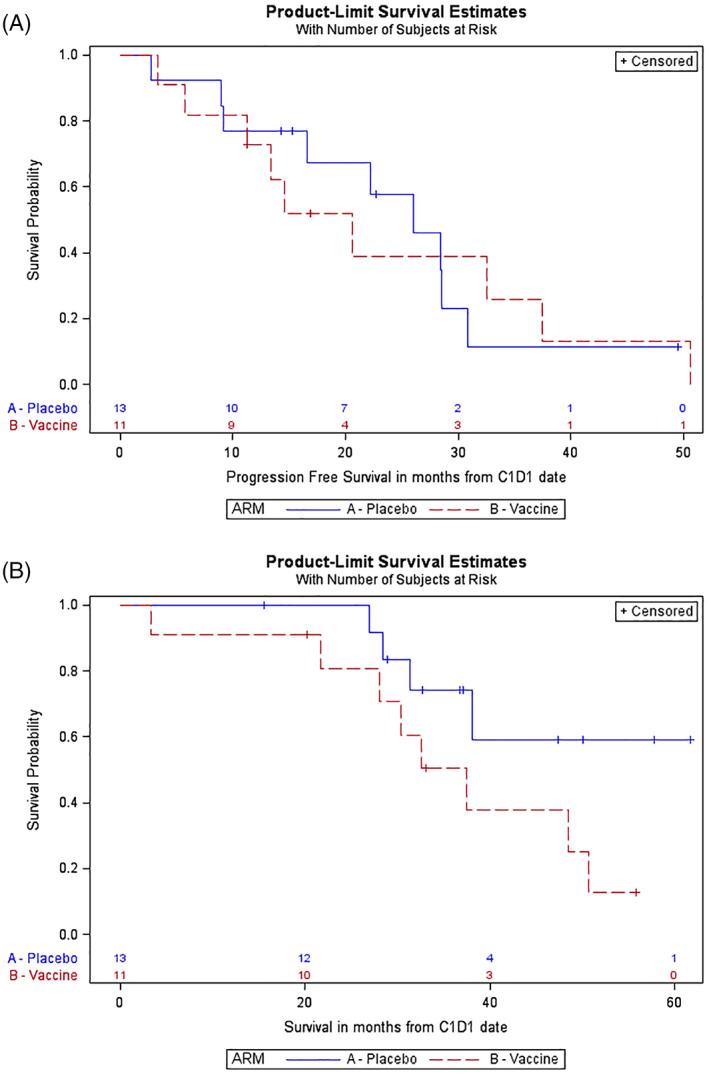
(A): Kaplan‐Meier curve of progression‐free survival (PFS). In the interventional arm (vaccine), median PFS was 20.6 months (95% confidence interval [CI], 5.7–37.5 months), 12‐month PFS was 72.7% (95% CI, 37.1–90.3 months), and 24‐month PFS was 39.0% (95% CI: 10.6–67.3%). In the control (placebo) arm, median PFS was 25.9 months (95% CI, 9.2–30.8 months), 12‐month PFS was 76.9% (95% CI, 44.2–91.9%), and 24‐month PFS was 57.7% (95% CI, 25.6–80.1%). There was no difference between the arms (p = .97). Hazard ratio (PFS) for vaccine versus placebo was 1.02 (95% CI, 0.38–2.71). (B): Kaplan‐Meier curve of overall survival (OS). In the interventional arm (vaccine), median OS was 37.5 months (95% CI, 21.6–50.6 months). In the control (placebo) arm, median OS was not reached. Hazard ratio (OS) for vaccine versus placebo was 2.65 (95% CI, 0.79–8.81). There was little difference between the arms (p = .10), but results somewhat favor placebo.