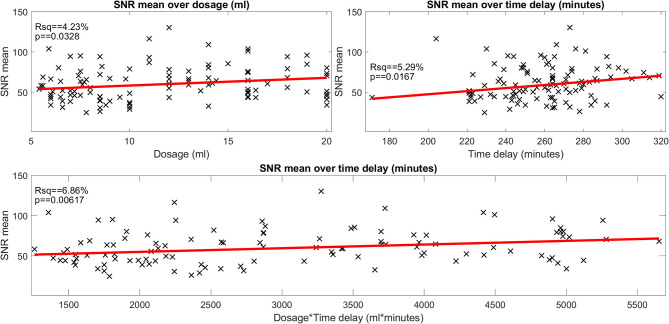
Figure 2.
Influence of gadolinium (Gd) dosage and Gd time delay on the signal-to-noise ratio (SNR) (belonging to question i). The scatter plot of the signal-to-noise ratio (SNR) over the gadolinium (Gd) dosage (in ml, plot in the top left), of the SNR over the time delay (in minutes, plot in the top right) and of the SNR over the interaction of Gd dosage × time delay (ml × minutes, plot in the bottom). SNR data points are plotted as black crosses and the trend lines of the fitted model are plotted as red lines. The SNR depended significantly on dosage, time delay as well as the interaction of dosage × time delay. However, the effect size was very small (4.2, 5.3, and 6.8% of explained variance, respectively). The SNR displayed here “SNR mean” is the mean of the SNRs calculated for each region of interest, i.e., the two inside the basal cochlear turn (CBT), the apex cochleae (AC), the horizontal semicircular canal (hSCC) as well as the posterior SCC (pSCC). For each region, the SNR is the mean signal divided by the standard deviation of the region labeled “air.” The left and the right ear are averaged for each region, before regions are averaged to form “SNR mean”.

