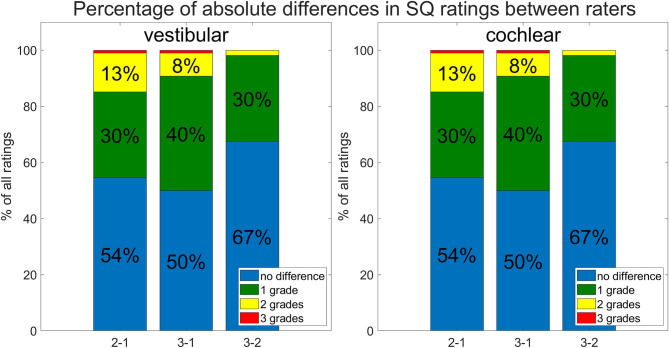
Figure 4.
Inter-rater and -threshold between ELH quantification methods (belonging to question ii). Shown are differences between the three raters. The differences between raters are shown as percentages of the total number of subjects rated. Most grades between raters agree (no difference; in blue), and the next largest difference was by 1 grade (in green), the remaining differences between raters were mostly 2 grades (in yellow) and rarely 3 grades (in red) apart.

