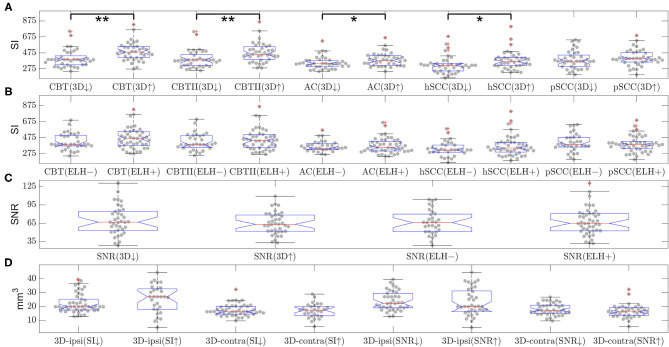
Figure 5.
Influence of endolymphatic hydrops (ELH) on signal intensity (SI) or signal-to-noise ratio (SNR) and vice versa (belonging to question iii). The top two rows (A,B) show the signal intensity (SI) in various areas of the inner ear. The SI values are split by either (A) 3D-quantification values (below or above median, indicated by a downward-arrow or an upward-arrow) or (B) endolymphatic hydrops (ELH) being absent [“–”] or present [“+”]. Here, “ELH absence” is defined as the average semi-quantitative (SQ) rating being zero and “ELH presence” is defined as the average rating being non-zero. Significant differences are indicated by black lines and p-values for the group differences evaluated with two-sample t-test or rank-sum test (**p < 0.001 and *p < 0.05). The third row (C) shows the mean SNR split by 3D-quantification values (below or above median; indicated by a downward-arrow or an upward-arrow), as well as the mean SNR split by ELH being absent [“–”] or present [“+”], where presence is defined as ELH being non-zero and absence as ELH rating being zero. The group differences were evaluated with the two-sample t-test and the rank-sum test; neither of these was significant. The fourth row (D) shows the 3D-quantification values split by mean SI values (below or above median; indicated by a downward-arrow or an upward-arrow), as well as the 3D-quantification values split by SNR values (below or above median; indicated by a downward-arrow or an upward-arrow). The group differences were evaluated with the two-sample t-test and the rank-sum test; neither of these was significant.

