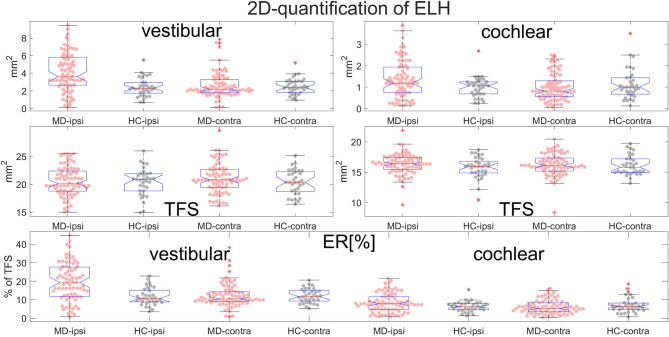
Figure 7.
Normalization and group differences for 2D-quantification of endolymphatic hydrops (ELH). 2D-quantification values of endolymphatic hydrops (ELH) in the vestibular and cochlear part of the inner ear, in [mm2] (top row). 2D-quantification values of the total fluid surface (TFS) of the vestibular and cochlear part of the inner ear, in [mm2] (middle row) that were used for normalizing the data of each individual to ELS ratio (ER) [%], the percentage of the TFS occupied by the ELH (bottom row).

