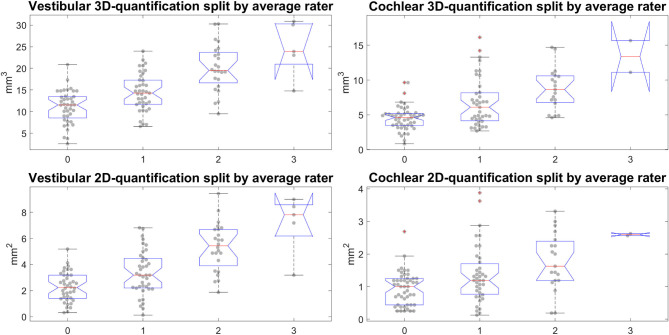
Figure 8.
Semi-quantitative (SQ) grade-specific 2D- and 3D-quantification values. These four plots show the quantitative endolymphatic hydrops (ELH) measures (3D-quantification in the top row and 2D-quantification in the bottom row) split up along the semi-quantitative visual grading steps (from grade 0 to grade 3 in steps of 1). This means each boxplot with data points overlaid shows the distribution of quantitative measures that correspond to the respective grading. The grading here is of the average over the three raters, rounded to the nearest integer to preserve gradings going from 0 to 3 in steps of 1. The top row shows the distributions for the 3D-quantification of ELH for vestibular and cochlear parts of the inner ear, left and right, respectively, while the bottom row shows the distributions for the 2D-quantification of ELH for vestibular and cochlear parts of the inner ear.

