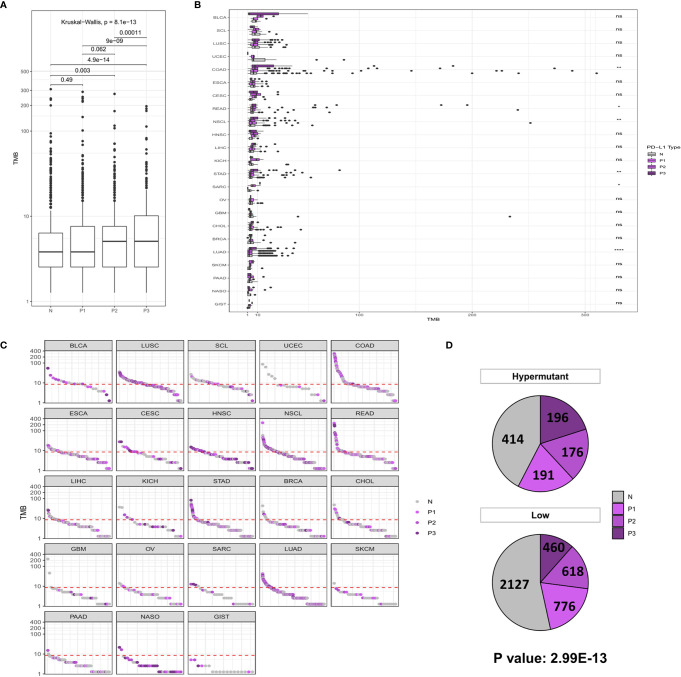
Figure 3.
(A) Comparison of TMB distribution among N, P1, P2, and P3 groups. (B) The TMB distribution of different cancers in the population is shown according to PD-L1 high and low groups. (C) TMB value of each sample in each cancer type. Shades of purples indicate the different levels of PD-L1 expression, while grays indicate PD-L1 negative samples. (D) The number and proportion of PD-L1 high and low samples in Hypermutation and Low groups. P < 0.05 was considered a significant difference, * P < 0.05, ** P < 0.01, **** P < 0.0001. NS, not significant.

