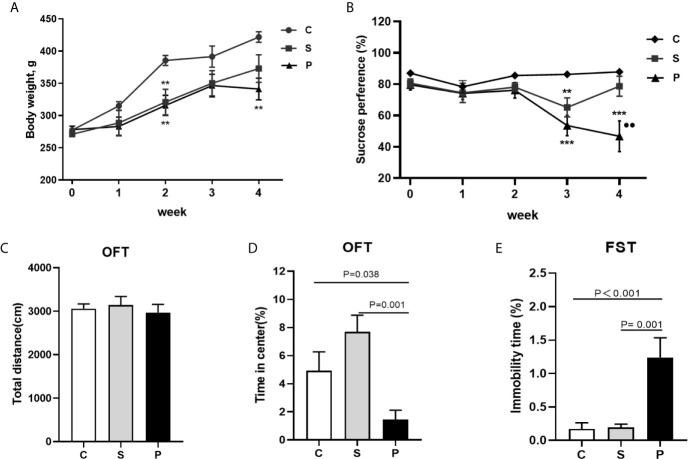
Figure 2.
Body weight and behavioral tests. (A) Body weight during CUMS of three group (n = 8 per group); (B) Sucrose preference during CUMS of three group (n = 8 per group); (C) The total distance of OFT was no significant difference among 3 groups after a 4-week CUMS exposure (n = 8 per group); (D) Percentage of duration time spent in the center square of OFT was compared among 3 groups after a 4-week CUMS exposure (n = 8 per group); (E) Immobility time comparison of FST among 3 groups after a 4-week CUMS exposure (n = 8 per group); C, Control; S, Stroke; P, PSD; PSD group vs. control group, **P < 0.01 and ***P < 0.001; PSD group vs. stroke group, ●● P < 0.01; SPT, sucrose preference test; OFT, Open field test; FST, Forced swimming test.

