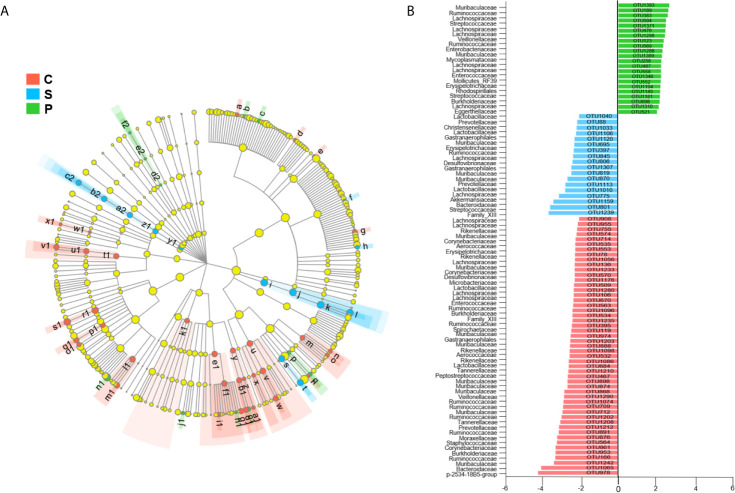
Figure 4.
Linear discriminant analysis effect size (LEfSe) analysis (LDA > 2.0). Cladogram (A) and histogram (B) illustrated 91 OTUs responsible for discriminating the PSD, stroke and control groups. Compared to stroke and control groups, the PSD rats were characterized by 22 discriminative OTUs (n = 6 per group).

