Figure 6.
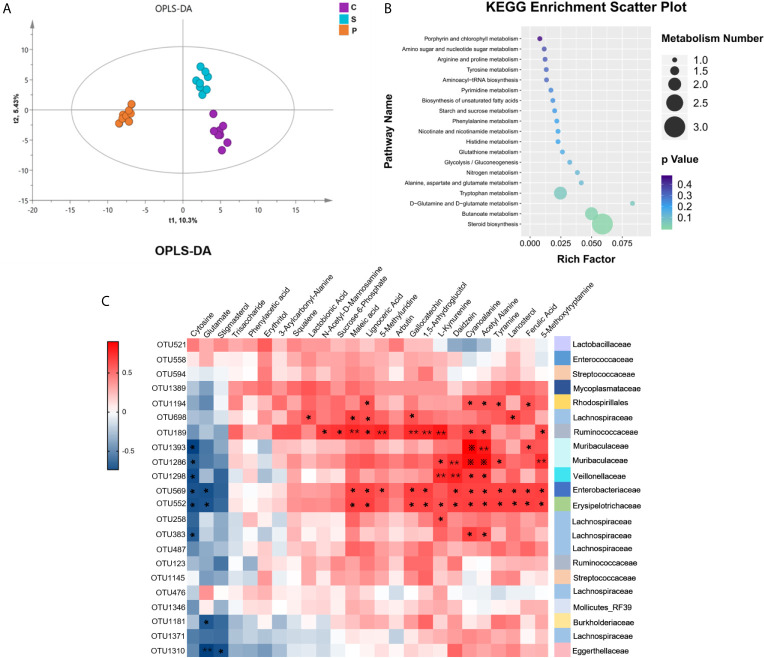
Fecal metabolism characteristics of PSD and its related KEGG enrichment pathways. (A) Orthogonal Partial Least Squares Discrimination Analysis (OPLS-DA) showed fecal metabolism of PSD was significantly different from that in control and stroke (n = 8 per group). (B) The 25 differential metabolites for PSD rats compared with control and stroke rats were enriched in 19 KEGG pathways. (C) Associations of gut microbial OTUs with fecal metabolites. Heat map of the spearman’s rank correlation coefficient of 22 discriminative OTUs and 25 differential metabolites for PSD. Red squares indicate positive associations between these microbial OTUs and metabolites, blue squares indicate negative associations (n = 8 per group). 54.55% (12/22 OTUs) of altered bacterial OTUs showing significant correlations with a range of differential metabolites (p < 0.05) and correlation coefficient were ≥ 0.6 or ≤ −0.6, tested by spearman correlation. The statistical significance was denoted on the squares (*p < 0.05; **p < 0.01; ※p < 0.001).

