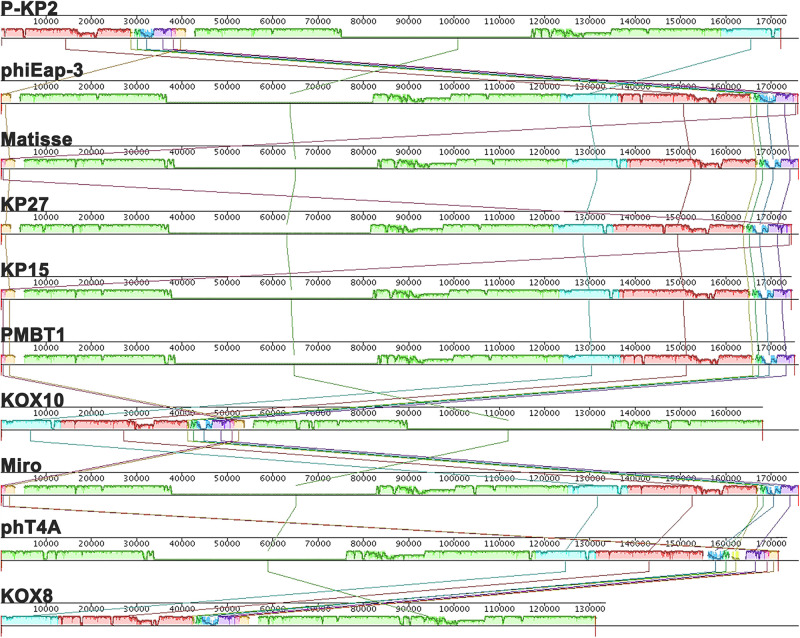
FIGURE 3.
Multiple genome alignments among P-KP2 and homologous phages. The graph was generated by Mauve software. To present the average conservation level in the genome sequence, the similarity of regions is indicated by the height of the bars. Fragment that are not aligned or specific to a particular genome are represented by white areas. Regions of homologous DNA shared by two or more genomes are defined as a local collinear blocks (LCBs), represented by boxes with the identical colors.

