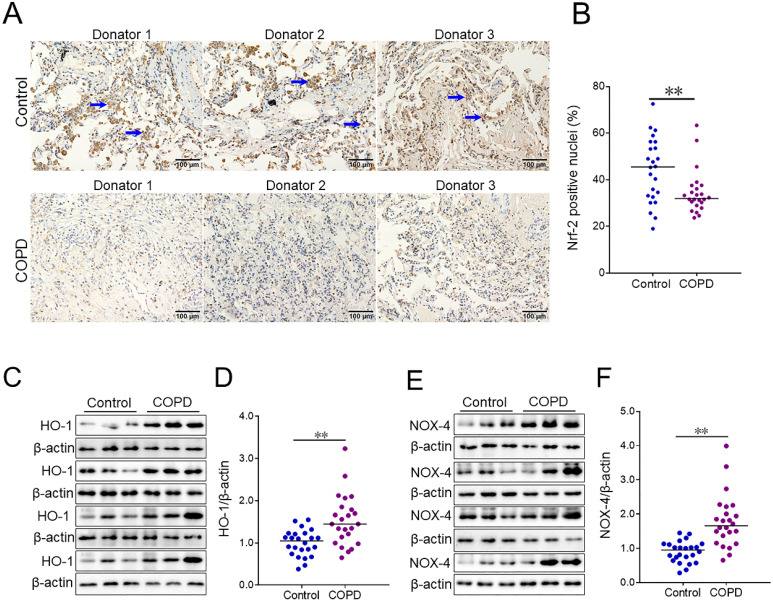
Figure 2.
The levels of oxidative stress markers between COPD patients and control subjects. (A, B) Pulmonary Nrf-2-positive nuclei were measured using IHC. (A) Representative field. Blue arrows indicate Nrf-2-positive nuclei. Original magnification: ×400. (B) Quantitative analysis of positive nuclei was performed. (C-F) Pulmonary HO-1 and NOX-4 were detected between COPD patients and control subjects through western blotting. (C) Representative bands of HO-1. (E) Representative bands of NOX-4. (D, F) Quantitative analysis of scanning densitometry was performed. All data were represented as means ± S.E.M. (N=24). **P<0.01.

