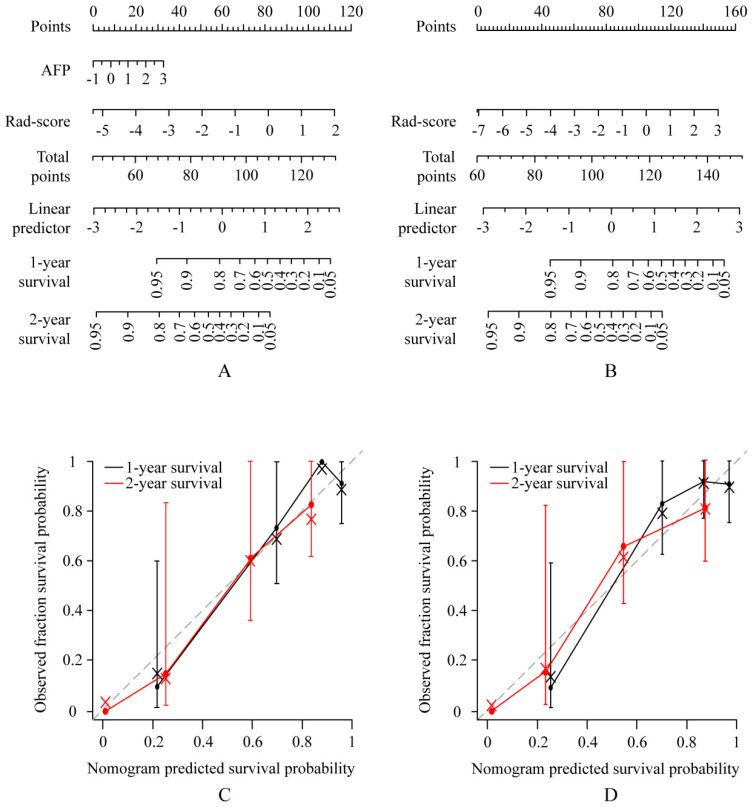
Figure 2.
Use of the constructed clinical-radiomics nomogram and radiomics nomogram to predict overall survival (OS) in patients with advanced HCC, along with the assessment of the model calibration. Clinical-radiomics nomogram (A) and radiomics nomogram (B). Locate the patient's Rad-score on the Rad-score axis. Draw a line straight upward to the points' axis to determine how many points toward the probability of OS the patient receives for his or her Rad-score. Repeat the process for each variable. Sum the points achieved for each of the risk factors. Locate the final sum on the Total Point axis. Draw a line straight down to find the patient's probability of OS. Calibration curves for the clinical-radiomics nomogram (C) and radiomics nomogram (D) show the calibration of each model in terms of the agreement between the predicted and the observed 1-and 2-year outcomes. Nomogram predicted OS is plotted on the x-axis; the observed fraction OS is plotted on the y-axis. Diagonal dotted line = a perfect prediction by an ideal model, in which the predicted outcome perfectly corresponds to the actual outcome. Solid line = performance of the nomogram, a closer lining of which with the diagonal dotted line represents a better prediction.

