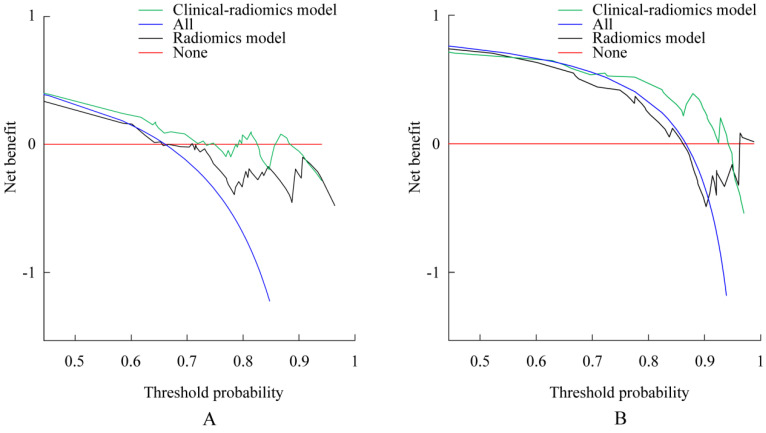
Figure 4.
Decision curve analysis for each model. Decision curve for the models of prediction overall survival (OS) with 1-year survival probability. (B) Decision curve for the models of prediction time to progression (TTP) with 3-month survival probability. The y-axis measures the net benefit. The net benefit was calculated by summing the benefits (true-positive results) and subtracting the harms (false-positive results), weighting the latter by a factor related to the relative harm of an undetected cancer compared with the harm of unnecessary treatment. The clinical-radiomics model had the highest net benefit compared with radiomics model and simple strategies such as follow-up of all patients (blue line) or no patients (red line) across the full range of threshold probabilities at which a patient would choose to undergo imaging follow-up.

