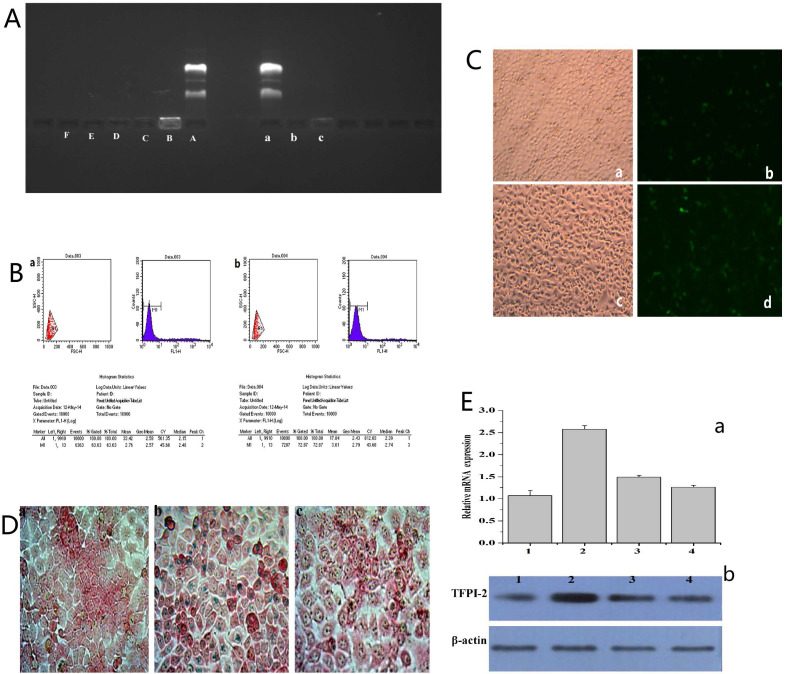
Figure 3.
(A) (A~F) Agarose gel electrophoresis retardation assay of FA-MNP/CDDP complexesat various N/P ratios; (a~c) DNase I degradation assay for FA-MNP/CDDP complexes at various N/P ratios. (B) Quantitative determination of transfected CNE-2 (a) and HNE-1 (b) cells by flow cytometry. (C) Fluorescence microscopy of green fluorescent protein expression. a: CNE-2 Optical microscope figure; b: CNE-2 Fluorescence microscope figure; c: HNE-1 Optical microscope figure; d: HNE-1 Fluorescence microscope figure (100×). (D) Iron stain: a: CNE-2; b: HNE-1; c: HNE-1 close folate receptor (400×). (E) (a) Expression of TFPI-2 mRNA determined by RT-PCR. (b) Representative TFPI-2protein expression determined by Western blot analysis (1: HNE-1 TFPI-2; 2: HNE-1 FA-MNP/CDDP/TFPI-2; 3: CNE-2 FA-MNP/CDDP/TFPI-2; 4: CNE-2 TFPI-2).

