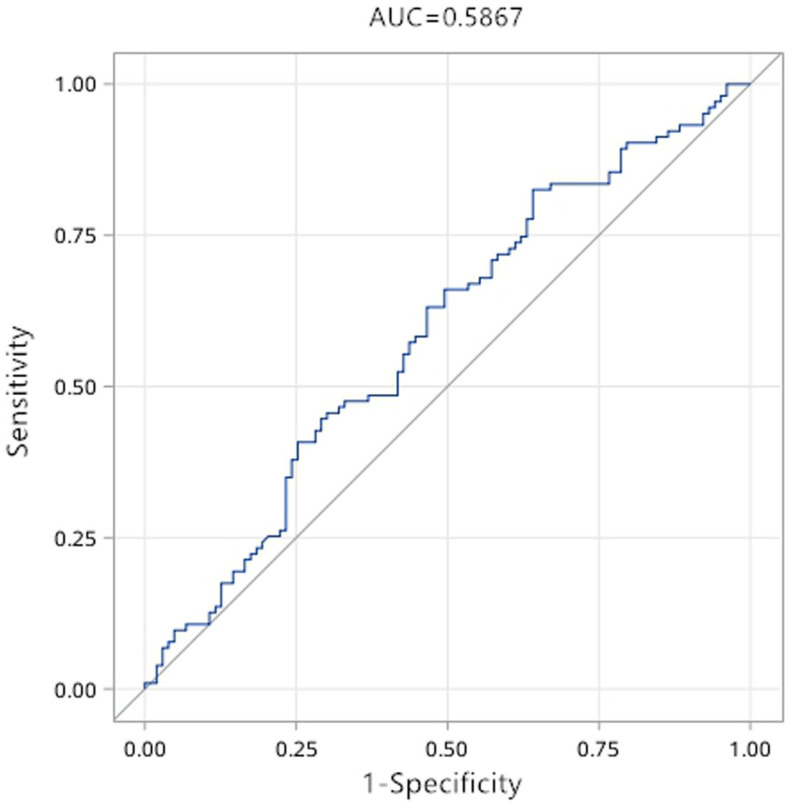
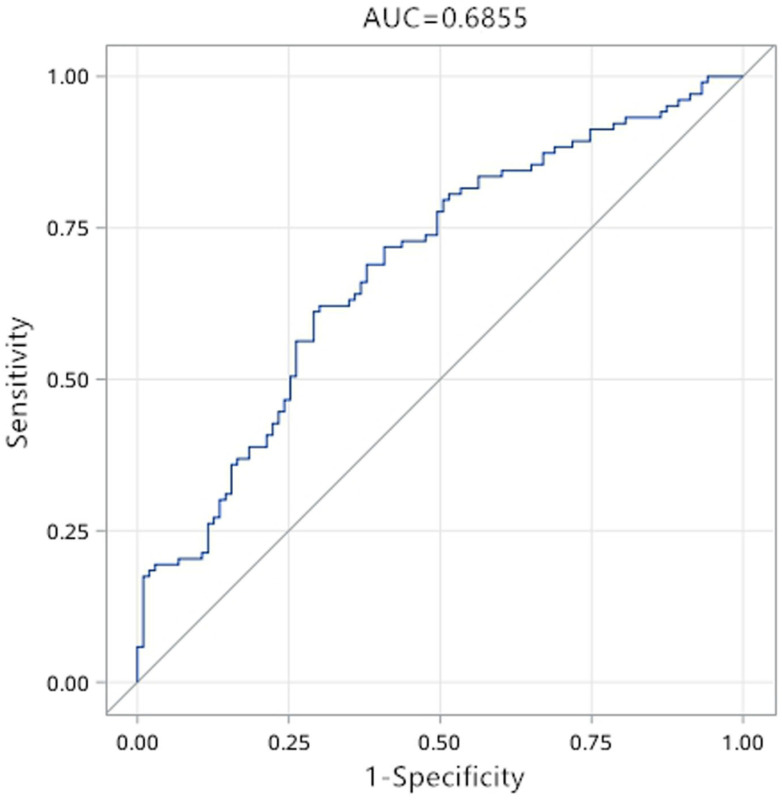
Figure 4.
ROC curve of hsa_circ_0071106 in diabetes. Note: The picture on the top is the ROC curve before adjustment, and the picture on the bottom is the ROC curve after adjusting the influencing factors such as occupation, blood lipid (AUC<0.5 has no diagnostic value, AUC>0.5 is diagnostic value).


