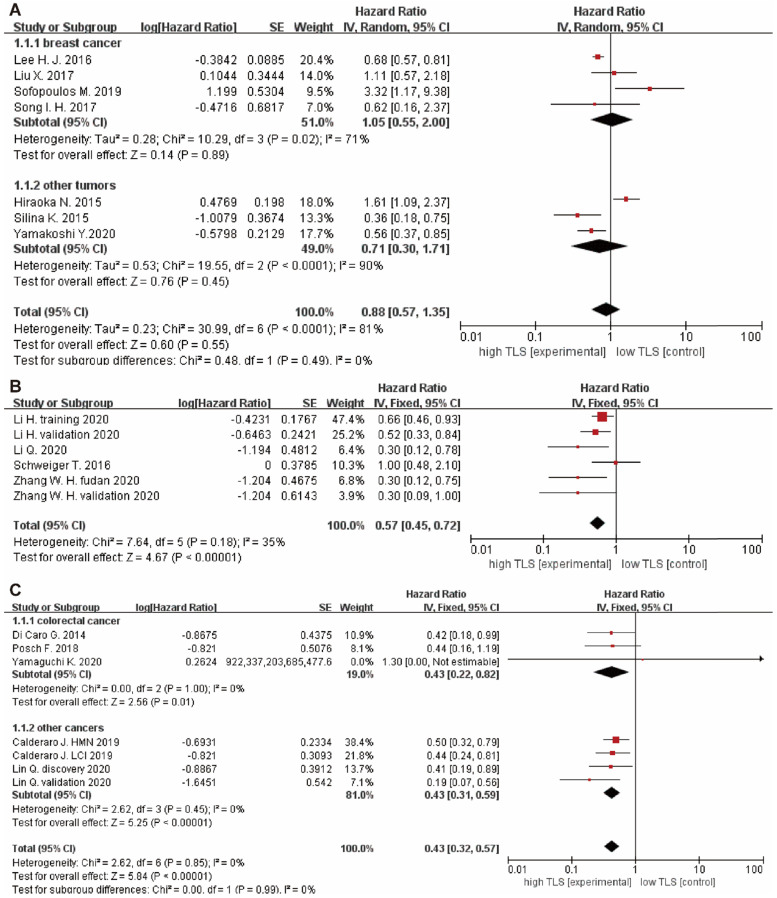
Figure 3.
Forest plot for DFS, RFS and relapse rate analysis. (A) DFS outcome of cancer with high TLS expression versus low TLS expression. (B) RFS outcome of cancer with high TLS expression versus low TLS expression. (C) Relapse rate outcome of cancer with high TLS expression versus low TLS expression. Each result is shown by the HR with 95%.

