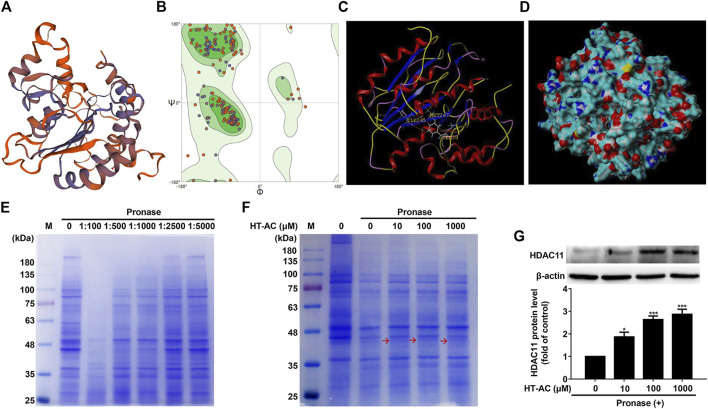
FIGURE 5.
HT-AC may target HDAC11 (A) Schematic SWISS-MODEL model of human HDAC11 (B) Ramachandran plot analysis of the three-dimensional structure of human HDAC11. The green, light green, and light blue regions represent the “most favored”, “additional allowed” and “generously allowed” regions that amino acid residue fall regions, respectively (C,D) The ability of HT-AC to bind to the HDAC11 ligand-binding domain by molecular docking (E) Cell lysates were subjected to pronase digestion at various mass ratios of pronase to protein (1:100, 1:500, 1:1,000, 1:2,500 and 1:5,000) and coomassie staining (F) After treatment with HT-AC (10, 100 and 1,000 μmol/L) for 2 h at 4°C, cell lysates were subjected to pronase digestion at the 1:1,000 pronase to protein mass ratio and coomassie staining (G) The protein expression of HDAC11 was examined by Western blotting in HUVECs following HT-AC treatment. *p < 0.05 and ***p < 0.001 vs. control group. Results are expressed as mean ± SEM (n = 3).

