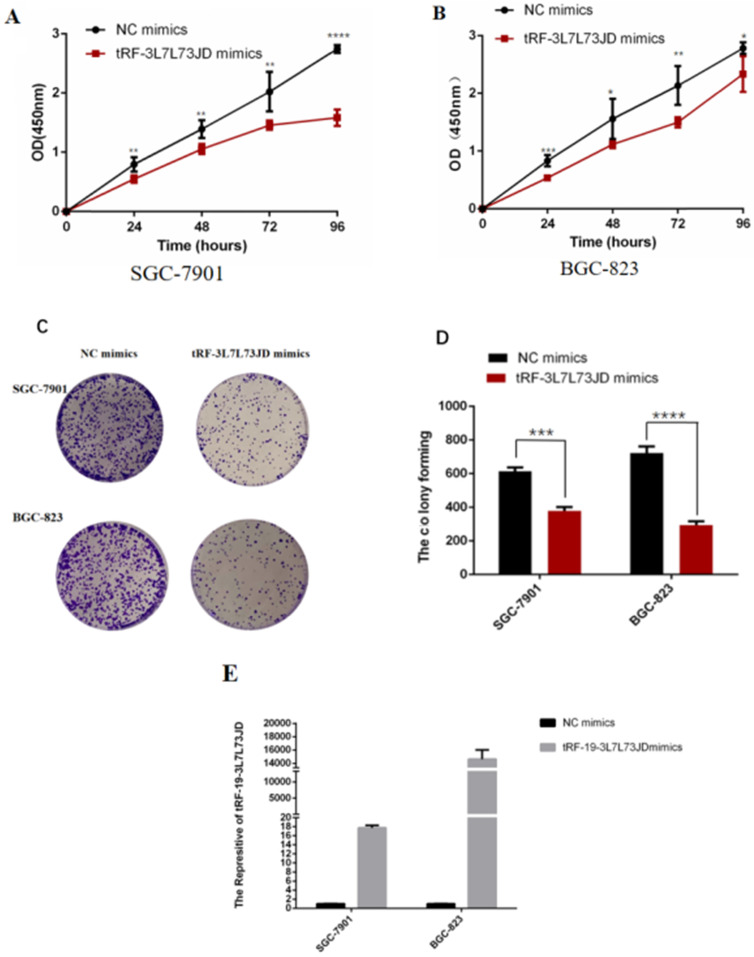
Figure 4.
Proliferation of gastric cancer cells after tRF-19-3L7L73JD up-regulation. A) Growth curves of SGC-7901. B) Growth curves of BGC-823. C) Representative cell colony forming assay of SGC-7901 and BGC-823. D) A statistical chart of cell colonies. E) Effect of tRF-19-3L7L73JD up-regulation in gastric cancer cell lines. NC, negative control. n=3, *P < 0.05, **P < 0.01, ***P < 0.001, ****P < 0.0001.

