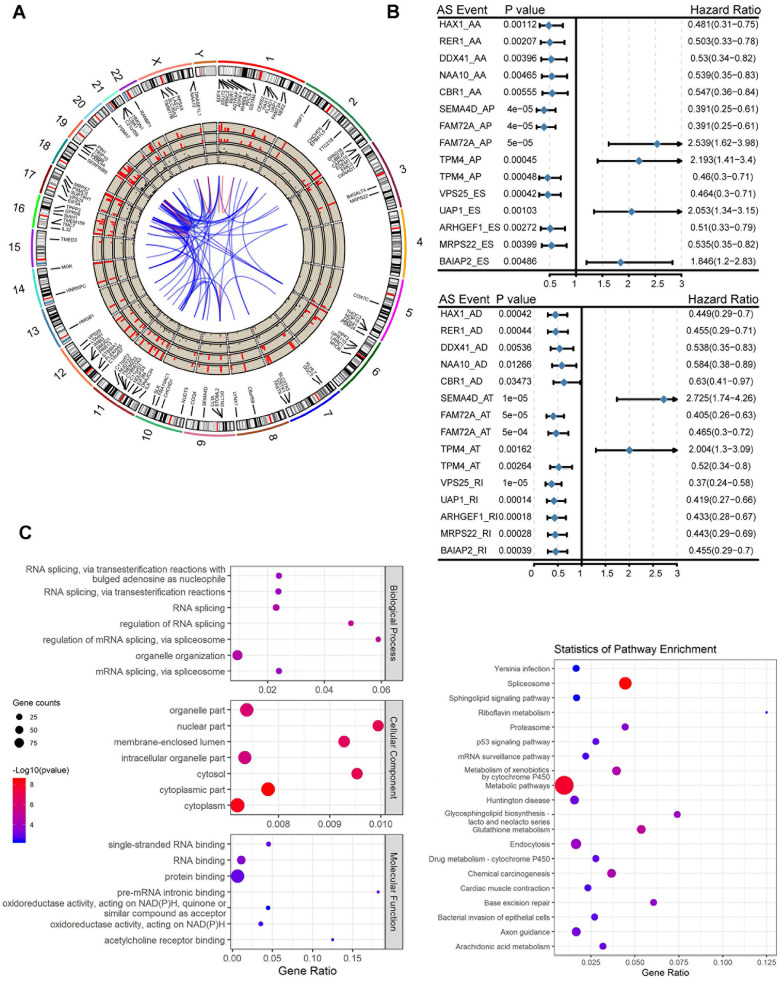
Figure 2.
Alternative splicing events statistics and GO functional enrichment analysis. (A) The Circos diagram of the survival-related alternative splicing events and its related genes, the Circos panel from the outside to the inside, is expressed as follows: chromosome number, genomic axis, survival-related alternative splicing event-related genes, names of related genes, the number of related genes occurring in the overall alternative splicing events (1-10 (>10), and showing 1-10 different heights, over 10 calculations on time), the number of alternative splicing types of related genes in the overall events, the p value of the relevant gene in the difference analysis (expressed by the conversion value of -log10 (p-values), and the higher the height, the more significant the p value), the fold change value of the relevant gene in the difference analysis (where red represents upregulation and black represents downregulation), correlation between genes. (B) A forest map of the most important TOP5 survival-related alternative splicing events in each of the alternative splicing types after single factor Cox regression analysis. (C) GO and KEGG Enrichment analysis results of survival-related alternative splicing event-related genes after one-way Cox regression analysis.

