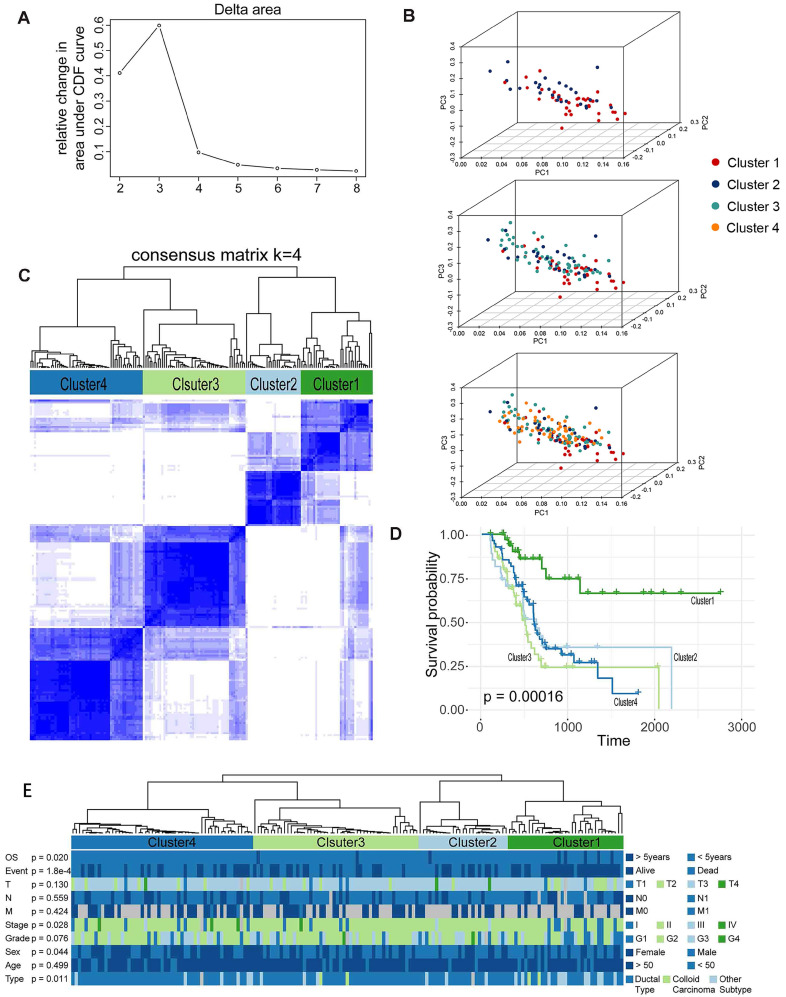
Figure 4.
Prognosis-associated molecular subtype cluster analysis. (A)-(B) Statistical analysis of Elbow for different numbers of clusters (k = 2 to 8) and PCA analysis for K=4. (C) The consensus matrix heat map defines four sample clusters with consensus values ranging from 0 (white, samples never gathered together) to 1 (dark blue, samples are always clustered together). (D) Survival analysis in the identified four sample clusters. (E) The distribution of each clinical information in four sample clusters.

