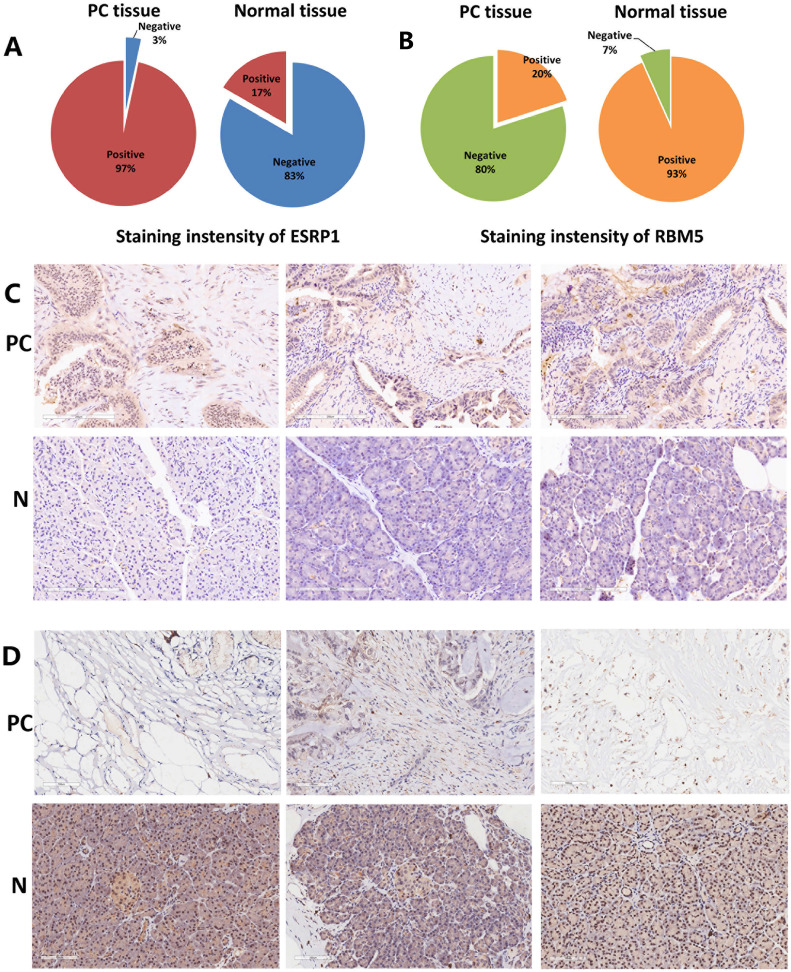
Figure 8.
Representative images for immunostaining of splicing factors ESRP1and RBM5. (A) Pie chart reports the numbers of PC tissues versus normal tissues with 'positive' or 'negative' ESRP1 staining. (B) Pie chart reports the numbers of PC tissues versus normal tissues with 'positive' or 'negative' RBM5 staining. (C) Immunostaining for ESRP1 of PC tissues and normal tissues (x200). (D) Immunostaining for RBM5 of PC tissues and normal tissues (x200).

