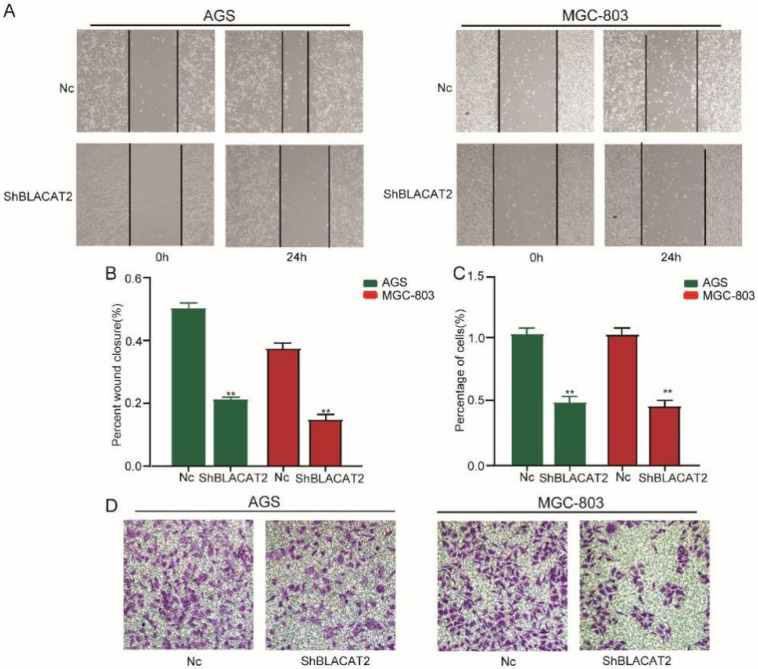
Figure 3.
Silencing of BLACAT2 suppressed gastric cancer cell migration and invasion in vitro. A: Transwell assays in the BLACAT2-silencing group compared with the Nc group in AGS and MGC-803 cells. The scratch was measured 24 hours later original magnification: 200×. The dotted black line outlines the cell boundary. B: Quantification of wound healing was performed in AGS and MGC-803 cells. C: The relative percentage of invasion cells of different groups were analyzed. D: Representative invasion images of BLACAT2 silenced and Nc cells. Quantifications of cells on the lower surface of the membrane were performed with three randomly chosen fields. Data was presented as means ± SD (*p < 0.05, **p < 0.01, and ***p < 0.001).

