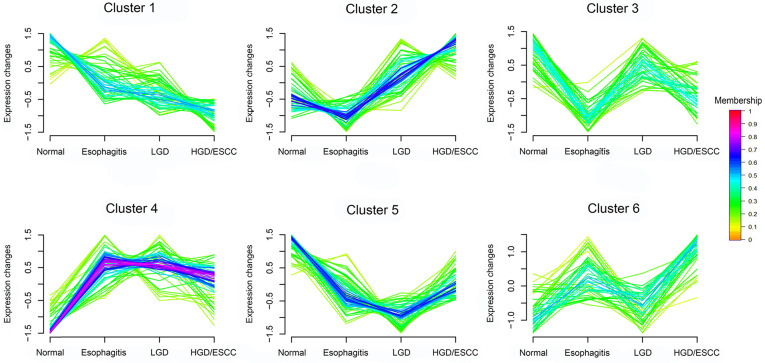
Figure 1.
FCM clustering analysis of 341 metabolites from normal participants to HGD/ESCC patients. LGD, low-grade dysplasia; HGD, high-grade dysplasia; ESCC, esophageal squamous cell carcinoma. Each of these lines represents a metabolite. The color of the line indicates the membership of the metabolite in cluster.

