
Figure 5.
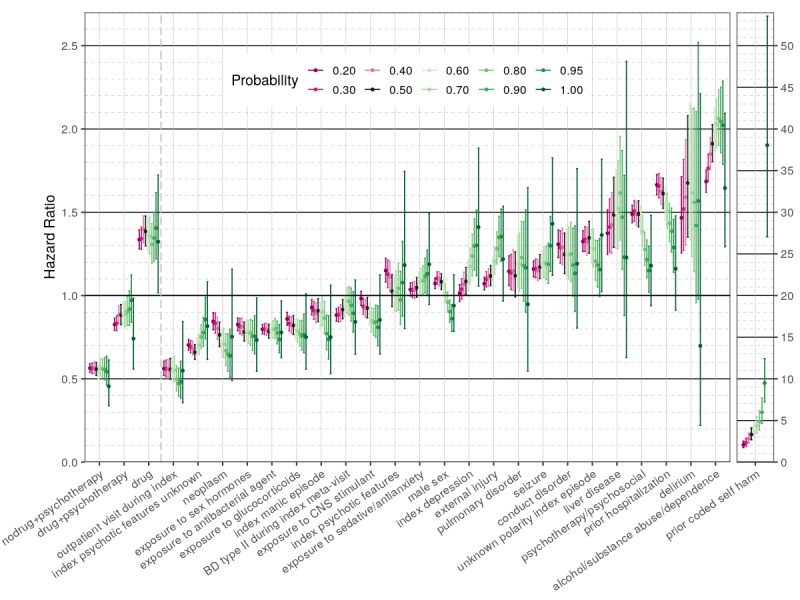
Sensitivity analysis for the “low-risk” and “high-risk” covariates in the second regression model comparing pharmacotherapy (as a single exposure category) and psychotherapy for the risk of self-harm. The X-axis shows 27 covariates and the respective 20%-100% self-harm probability thresholds chosen to impute the outcome. The Y-axis shows the respective hazard ratios (HRs) (colored dots) and CIs (colored lines). Varied intensity magenta is used to represent the range of 20%-40% self-harm probability thresholds, black is used to represent the 50% threshold of the main model, and varied intensity green is used to represent the 60%-100% probability threshold used. The covariate “prior coded self-harm” is separated out with a different HR scale in the far right, since the HR values were extremely high at the 100% (coded) probability threshold. BD: bipolar disorder; CNS: central nervous system; Drug: any of the bipolar disorder drugs of interest.