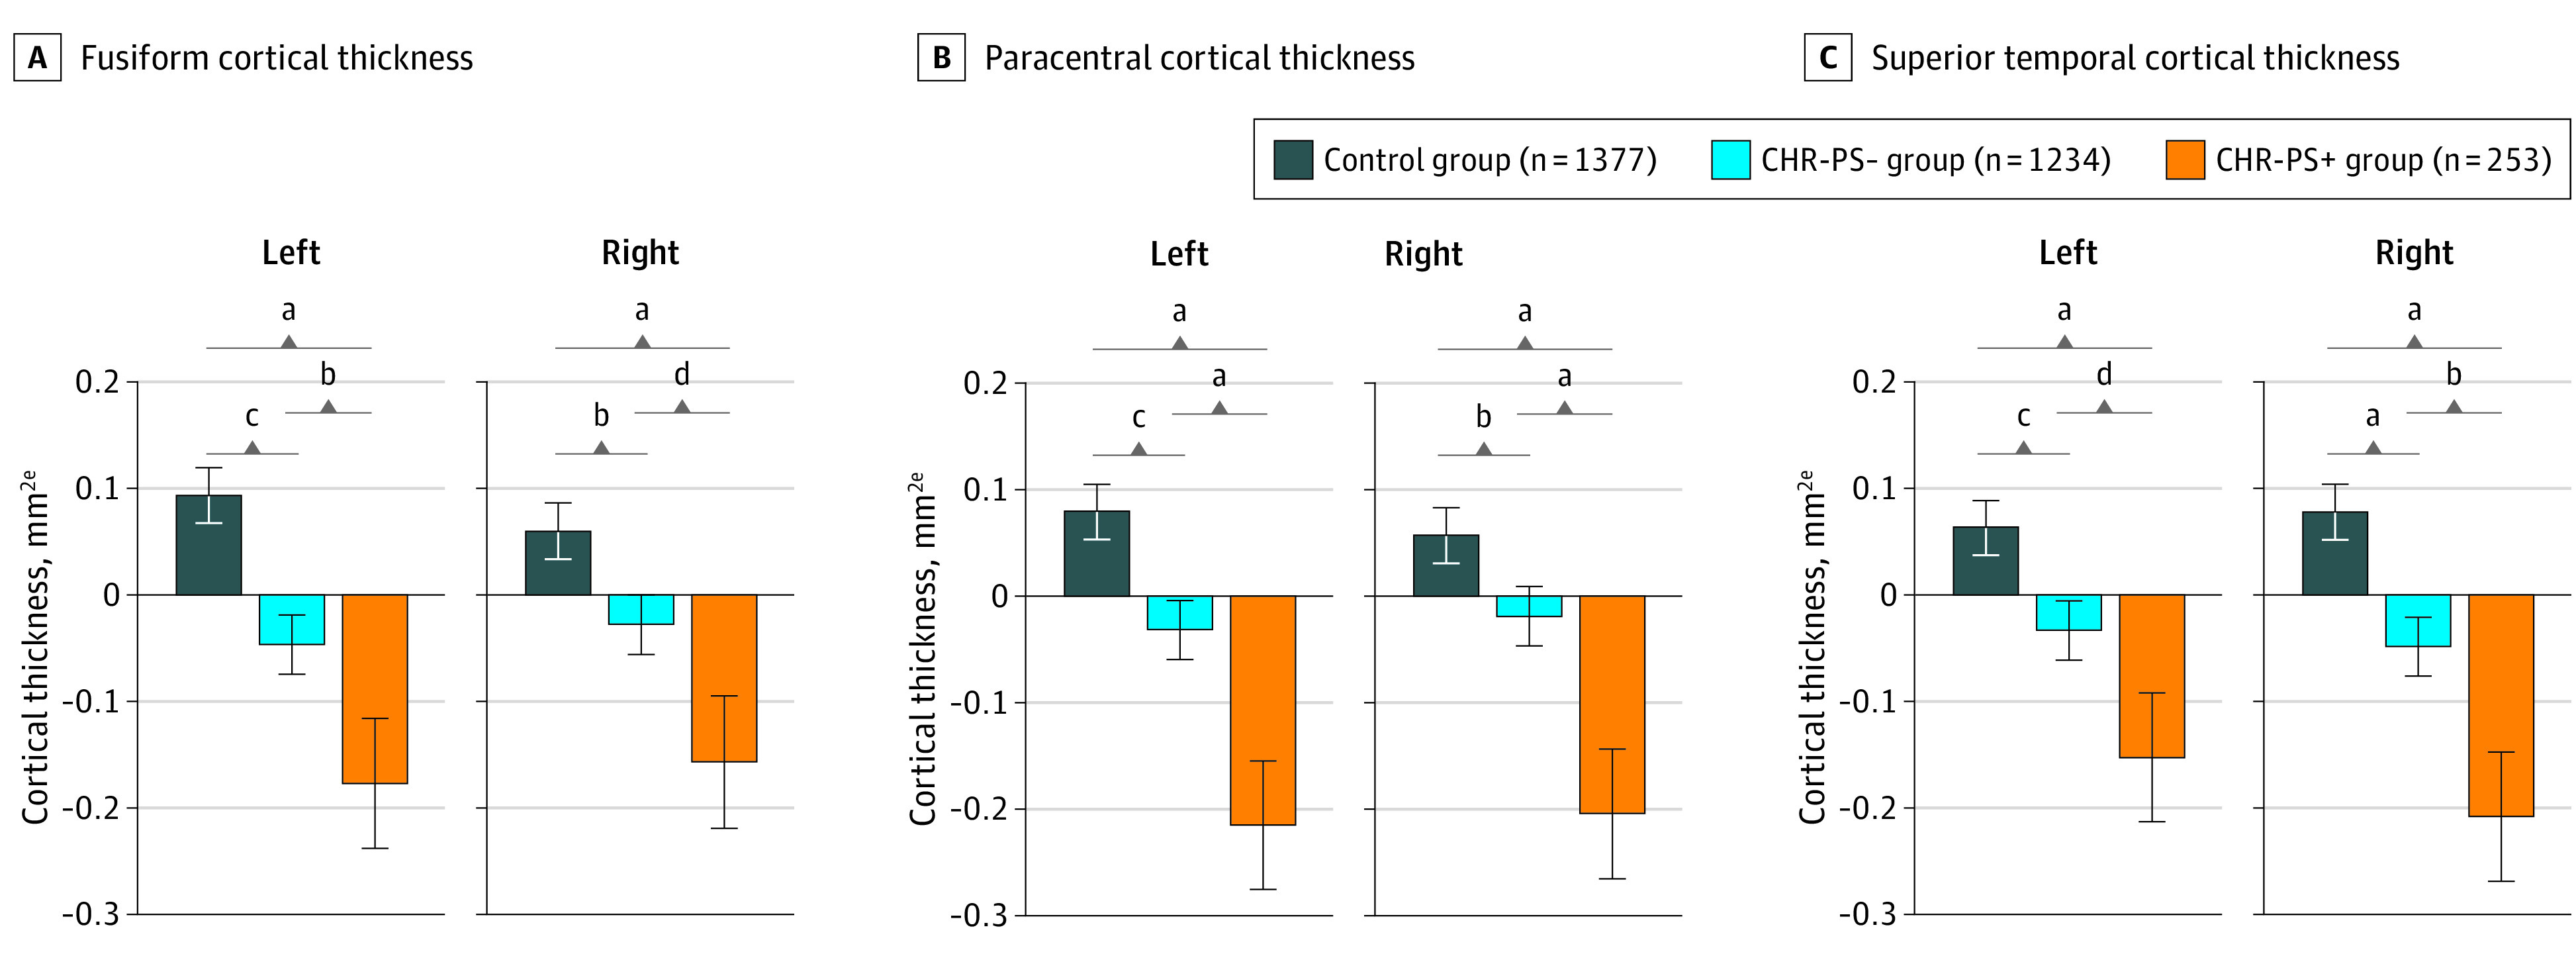
Figure 2. Bar Graphs for Regions in Which Individuals at Clinical High Risk Who Later Developed a Psychotic Disorder (CHR-PS+) Had Lower Cortical Thickness Compared With Those Who Did Not Later Develop a Psychotic Disorder (CHR-PS−) and Healthy Controls.

aP ≤ .001.
bP < .05.
cP ≤ .01.
dP < .10.
eCortical thicknesses normalized to a mean of 0.
