
Figure 72.
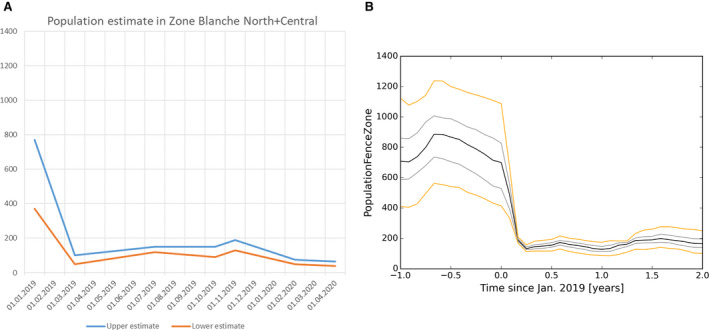
A–B. Development of the population size inside the fenced part of the WZ‐FR (intense hashed red in Figure 71) according to MS data (A) and model output (B)
Official websites use .gov
A
.gov website belongs to an official
government organization in the United States.
Secure .gov websites use HTTPS
A lock (
) or https:// means you've safely
connected to the .gov website. Share sensitive
information only on official, secure websites.
A–B. Development of the population size inside the fenced part of the WZ‐FR (intense hashed red in Figure 71) according to MS data (A) and model output (B)