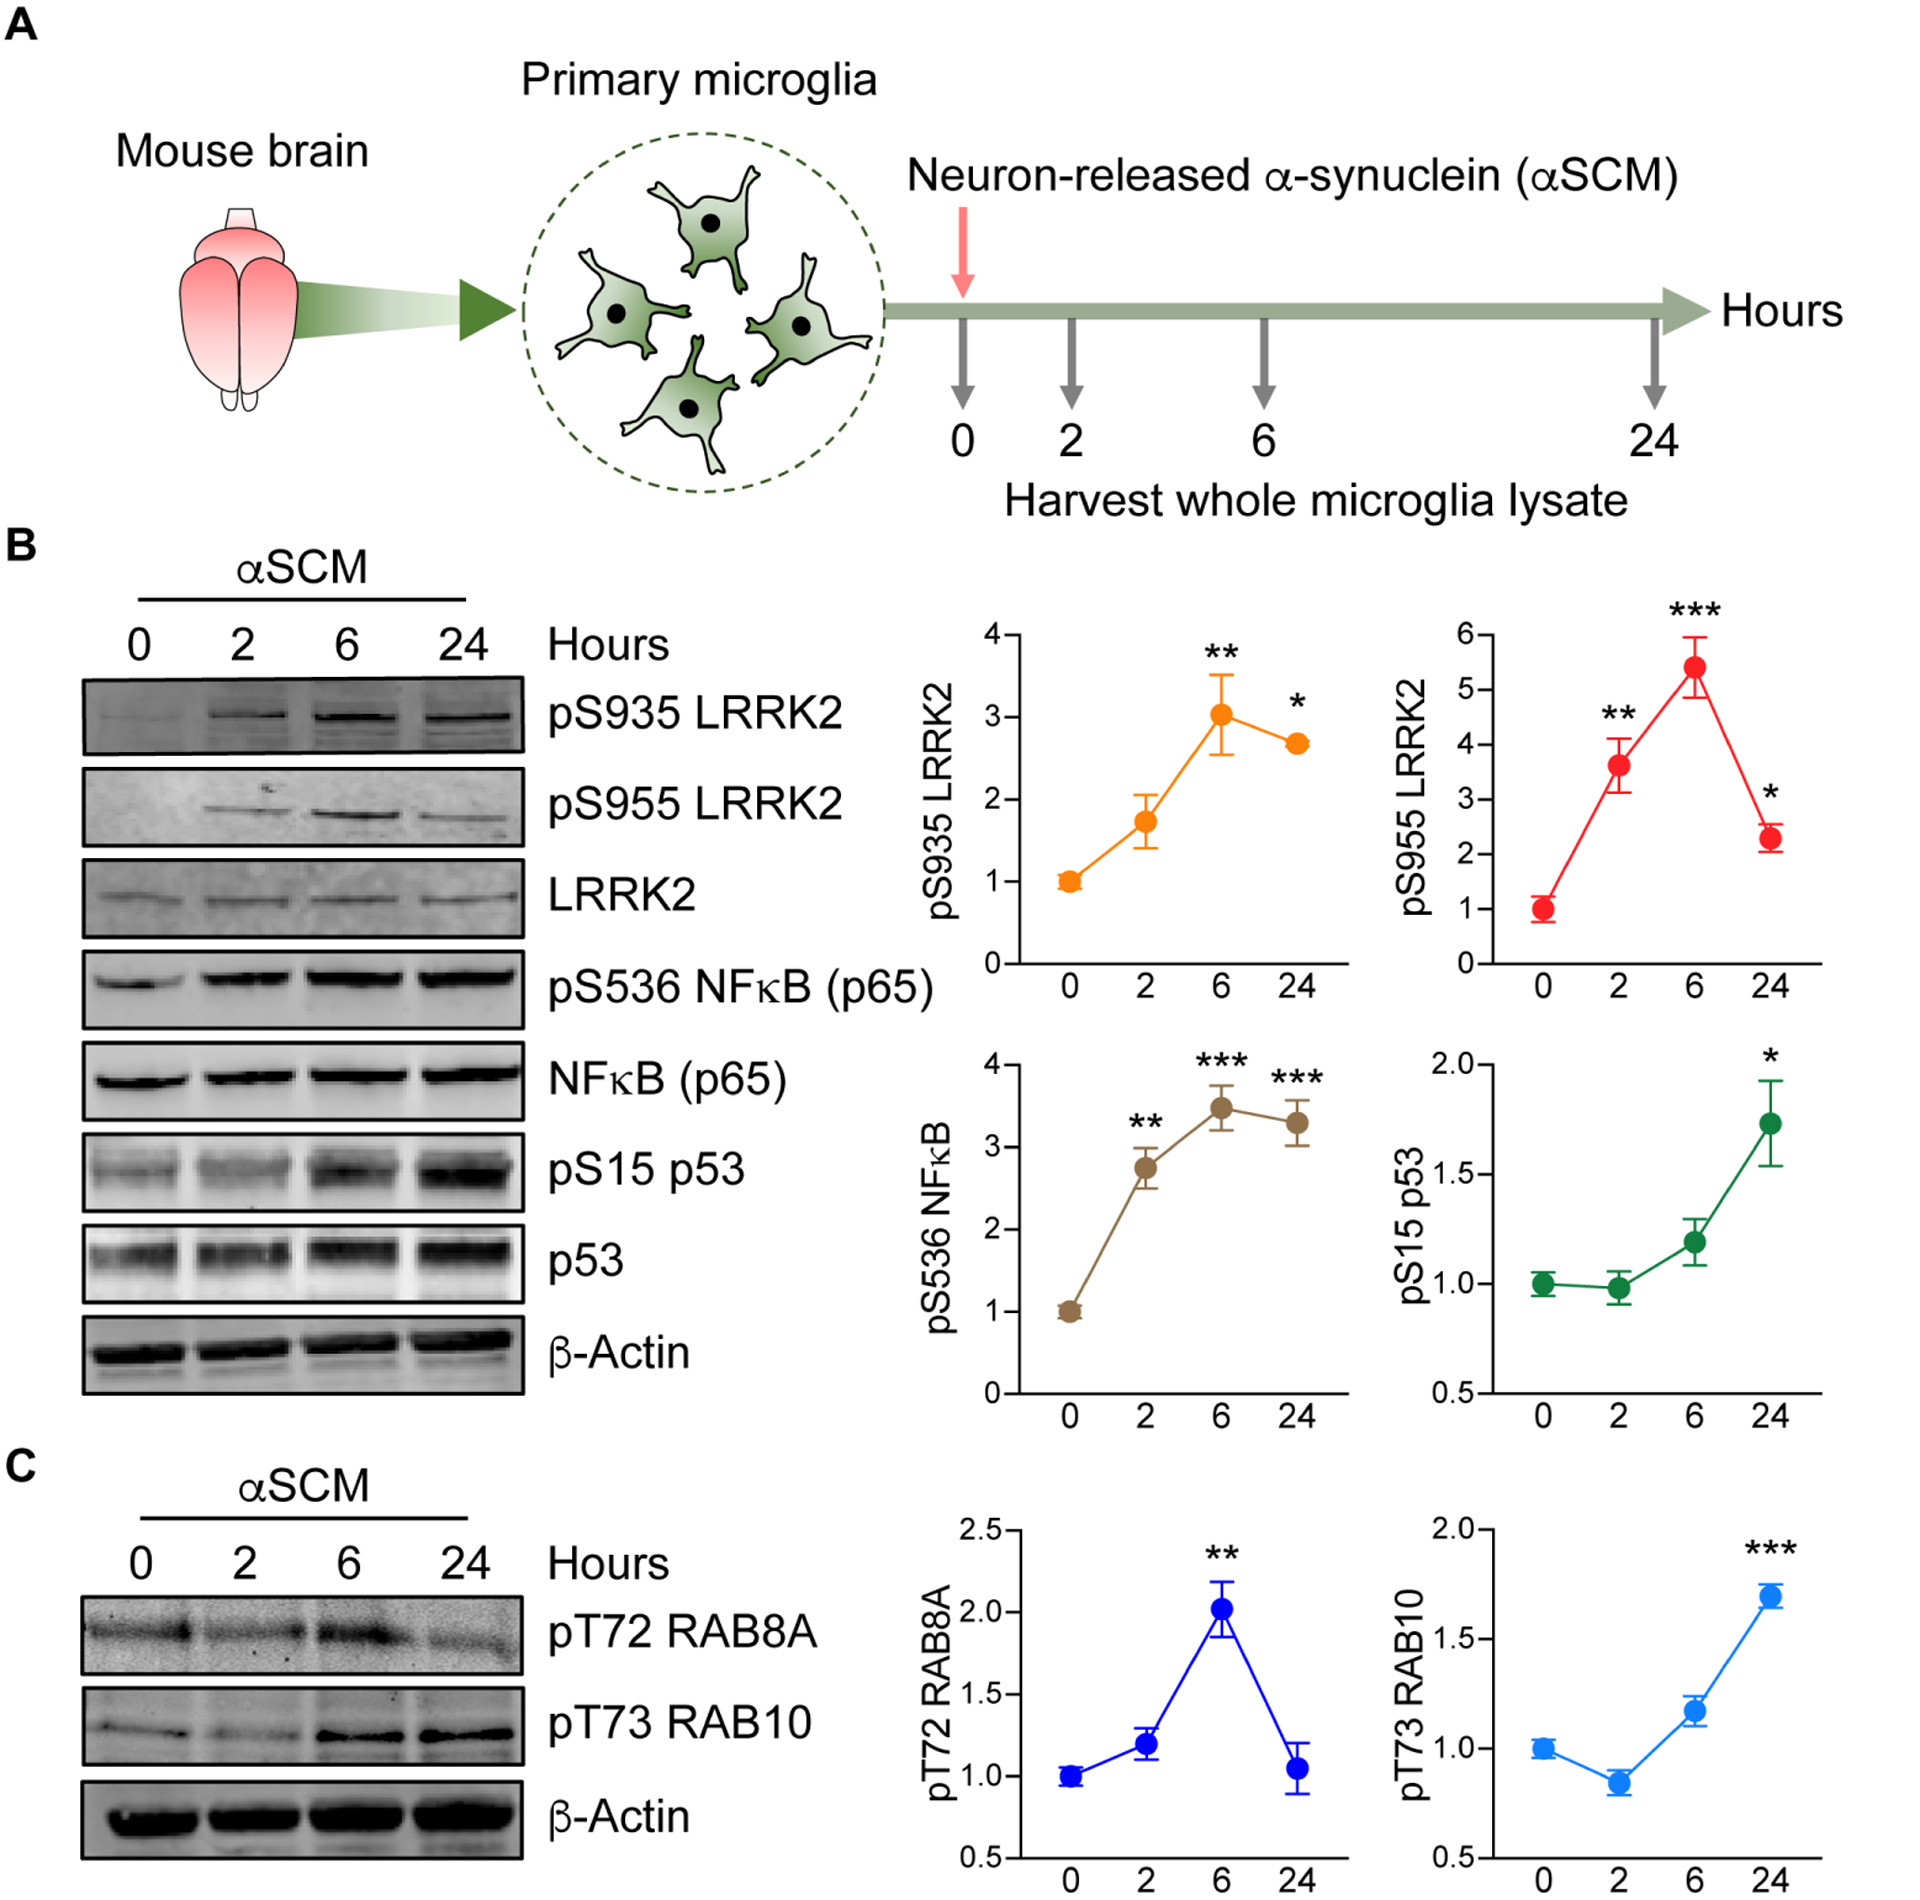
Fig. 1. Neuron-released α-synuclein activates microglial LRRK2.

(A) Schematic illustration of treatment of primary microglia with neuron-released α-synuclein (αSCM). (B) Primary wild type mouse microglia were treated with αSCM for 0, 2, 6, and 24 hours and whole cell lysates were analyzed by western blot. The band intensities of phosphorylated LRRK2, NFκB, and p53 were quantified by densitometric quantification and normalized to the respective total protein. Data are means ± SEM. *P < 0.05, **P < 0.01, and ***P < 0.001 (One-way ANOVA with Tukey’s multiple comparison post-hoc test). n = 3 per group. (C) Phosphorylation of RAB8A and RAB10 in αSCM-exposed microglia were visualized by western blot analysis. Phospho-T72 RAB8A and phospho-T73 RAB10 were determined by densitometric quantification and normalized to total RAB8A and RAB10, respectively. Data are means ± SEM. **P < 0.01 and ***P < 0.001 (One-way ANOVA with Tukey’s multiple comparison post-hoc test). n = 3 per group.
