
Fig. 2. LRRK2-dependent microglial-mediated neurotoxicity after exposure to neuron-released α-synuclein.
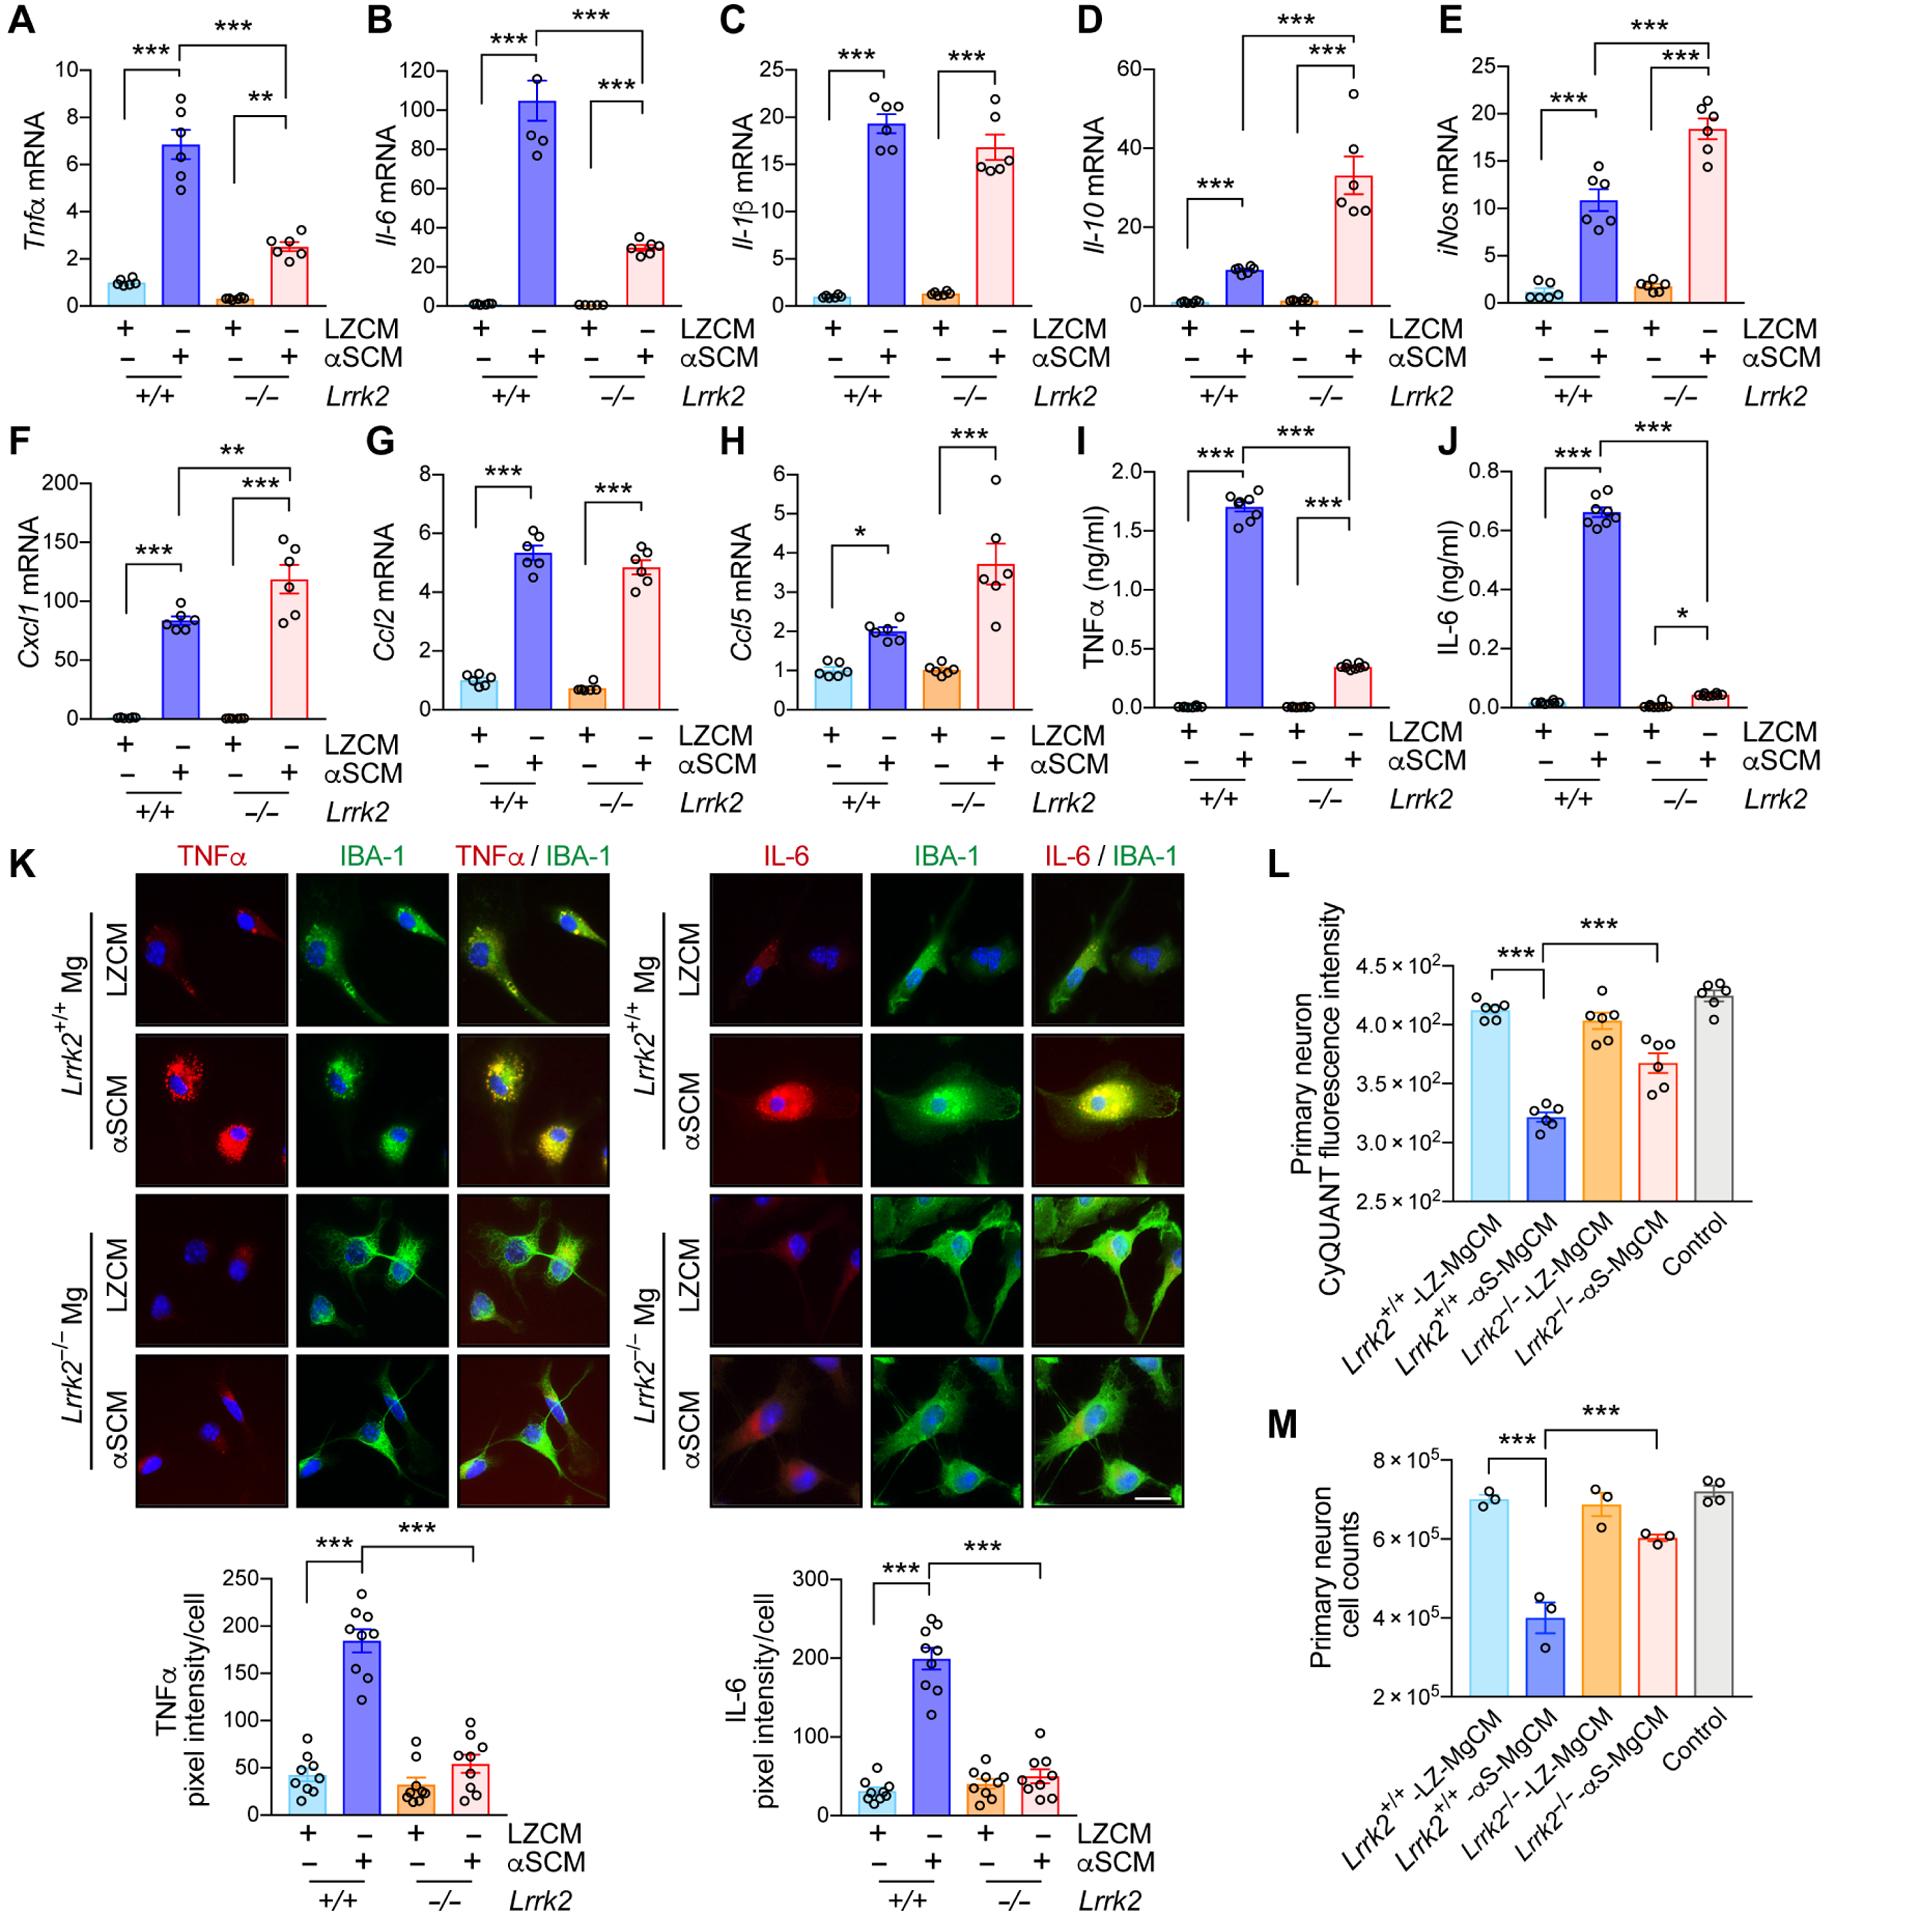
(A to K) Primary wild type and Lrrk2−/− microglia were treated with either control CM (LZCM) or αSCM for 6 hours. Microglial expression of Tnfα (A), Il-6 (B), Il-1β (C), Il-10 (D), iNos (E), Cxcl1 (F), Ccl2 (G), and Ccl5 (H) were determined by quantitative PCR. Data are means ± SEM. *P < 0.05, **P < 0.01, and ***P < 0.001 (One-way ANOVA with Tukey’s multiple comparison post-hoc test). n = 4–6 per group. (I and J) Microglial secretion of TNFα (I) and IL-6 (J) were determined by ELISA. Data are means ± SEM. *P < 0.05 and ***P < 0.001 (One-way ANOVA with Tukey’s multiple comparison post-hoc test). n = 8 per group. (K) Representative images from double immunostaining of TNFα and IL-6 with microglial marker IBA-1. Immunofluorescence intensity of TNFα and IL-6 was analyzed in a randomly chosen area. Data are means ± SEM. ***P < 0.001 (One-way ANOVA with Tukey’s multiple comparison post-hoc test). n = 9 per group. Scale bar, 20 μm. (L and M) Determination of microglia-mediated neurotoxicity. Primary mouse neurons were treated with control media, wild type-LZ-MgCM, wild type-αS-MgCM, Lrrk2−/−-LZ-MgCM, or Lrrk2−/−-αS-MgCM for 18 hours. (L) The number of live neurons were counted using an automated cell counter. Data are means ± SEM. ***P < 0.001 (One-way ANOVA with Tukey’s multiple comparison post-hoc test). n = 6 per group. (M) Neuronal cell viability was determined by the CyQuant cell proliferation assay. Data are means ± SEM. ***P < 0.001 (One-way ANOVA with Tukey’s multiple comparison post-hoc test). n = 3–4 per group.