
Fig. 4. LRRK2 modulates nuclear translocation of NFATc2 in microglia.
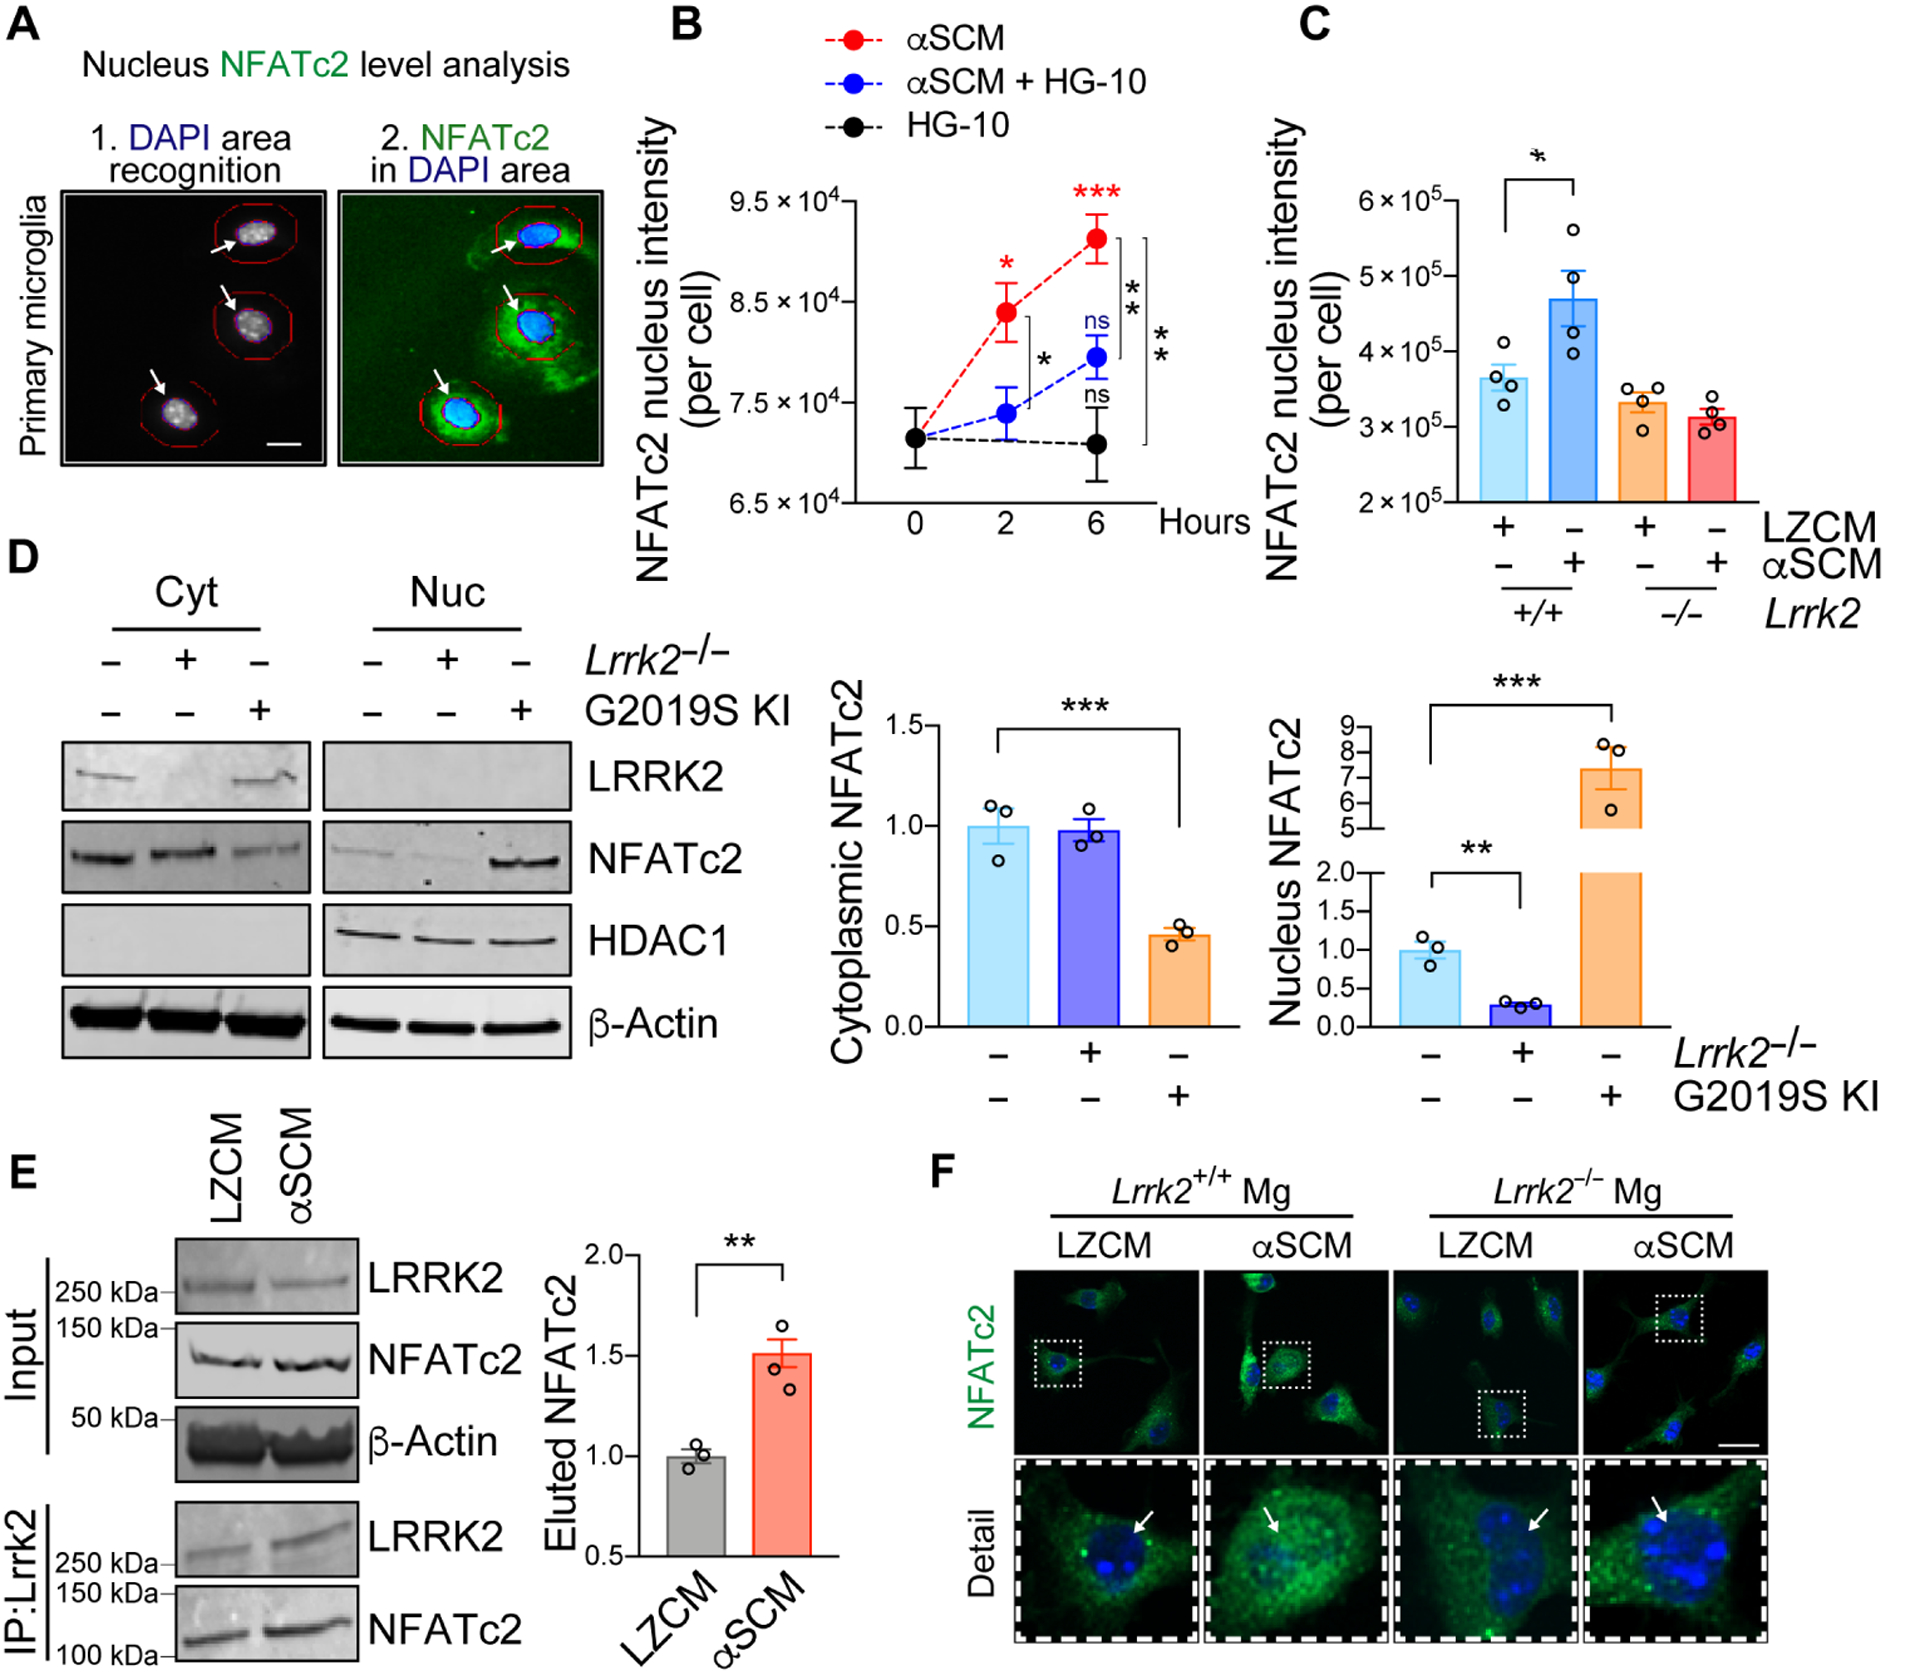
(A to C) Primary mouse wild type or Lrrk2−/− microglia were treated with αSCM in the presence or absence of LRRK2 kinase inhibitor HG-10-102-01 (100 nM). Cytoplasmic and nuclear fractions of NFATc2 were determined by an automated Cellomics assay. (A) Schematic illustration of compartmentalization analysis in single cells by Cellomics VTI Arrayscan. Scale bar, 10 μm. (B) Wild type mouse microglia were treated with αSCM, LRRK2 inhibitor, or both for 0, 2, and 6 hours. Data are means ± SEM. *P < 0.05, **P < 0.01, and ***P < 0.001 (One-way ANOVA with Tukey’s multiple comparison post-hoc test). n = 5 per group. (C) Mouse wild type or Lrrk2−/− microglia were treated with either LZCM or αSCM for 6 hours. Data are means ± SEM. *P < 0.05 (One-way ANOVA and Tukey’s multiple comparison post-hoc test). n = 4 per group. (D) Soluble proteins in the nuclear and cytoplasmic fractions of primary microglia from wild type, Lrrk2−/−, and G2019S KI mice were analyzed by western blot analysis. Cytoplasmic and nuclear fractions of NFATc2 were determined by densitometric quantification and normalized to β-Actin. Data are means ± SEM. **P < 0.01 and ***P < 0.001 (One-way ANOVA with Tukey’s multiple comparison post-hoc test). n = 3 per group. (E) Co-immunoprecipitation of LRRK2 and NFATc2. Primary microglia were treated with αSCM for 6 hours prior to immunoprecipitation assay. LRRK2 was pulled down from cell lysates and analyzed by western blot analysis. **P < 0.01 (One-way ANOVA with Tukey’s multiple comparison post-hoc test). n = 3 per group. (F) Representative images from immunostaining of NFATc2 in wild type and Lrrk2−/− microglia. Microglia were treated with either LZCM or αSCM for 6 hours prior to immunostaining analysis. Scale bar, 20 μm.