
Fig. 7. NFATc2 deposition in synucleinopathies.
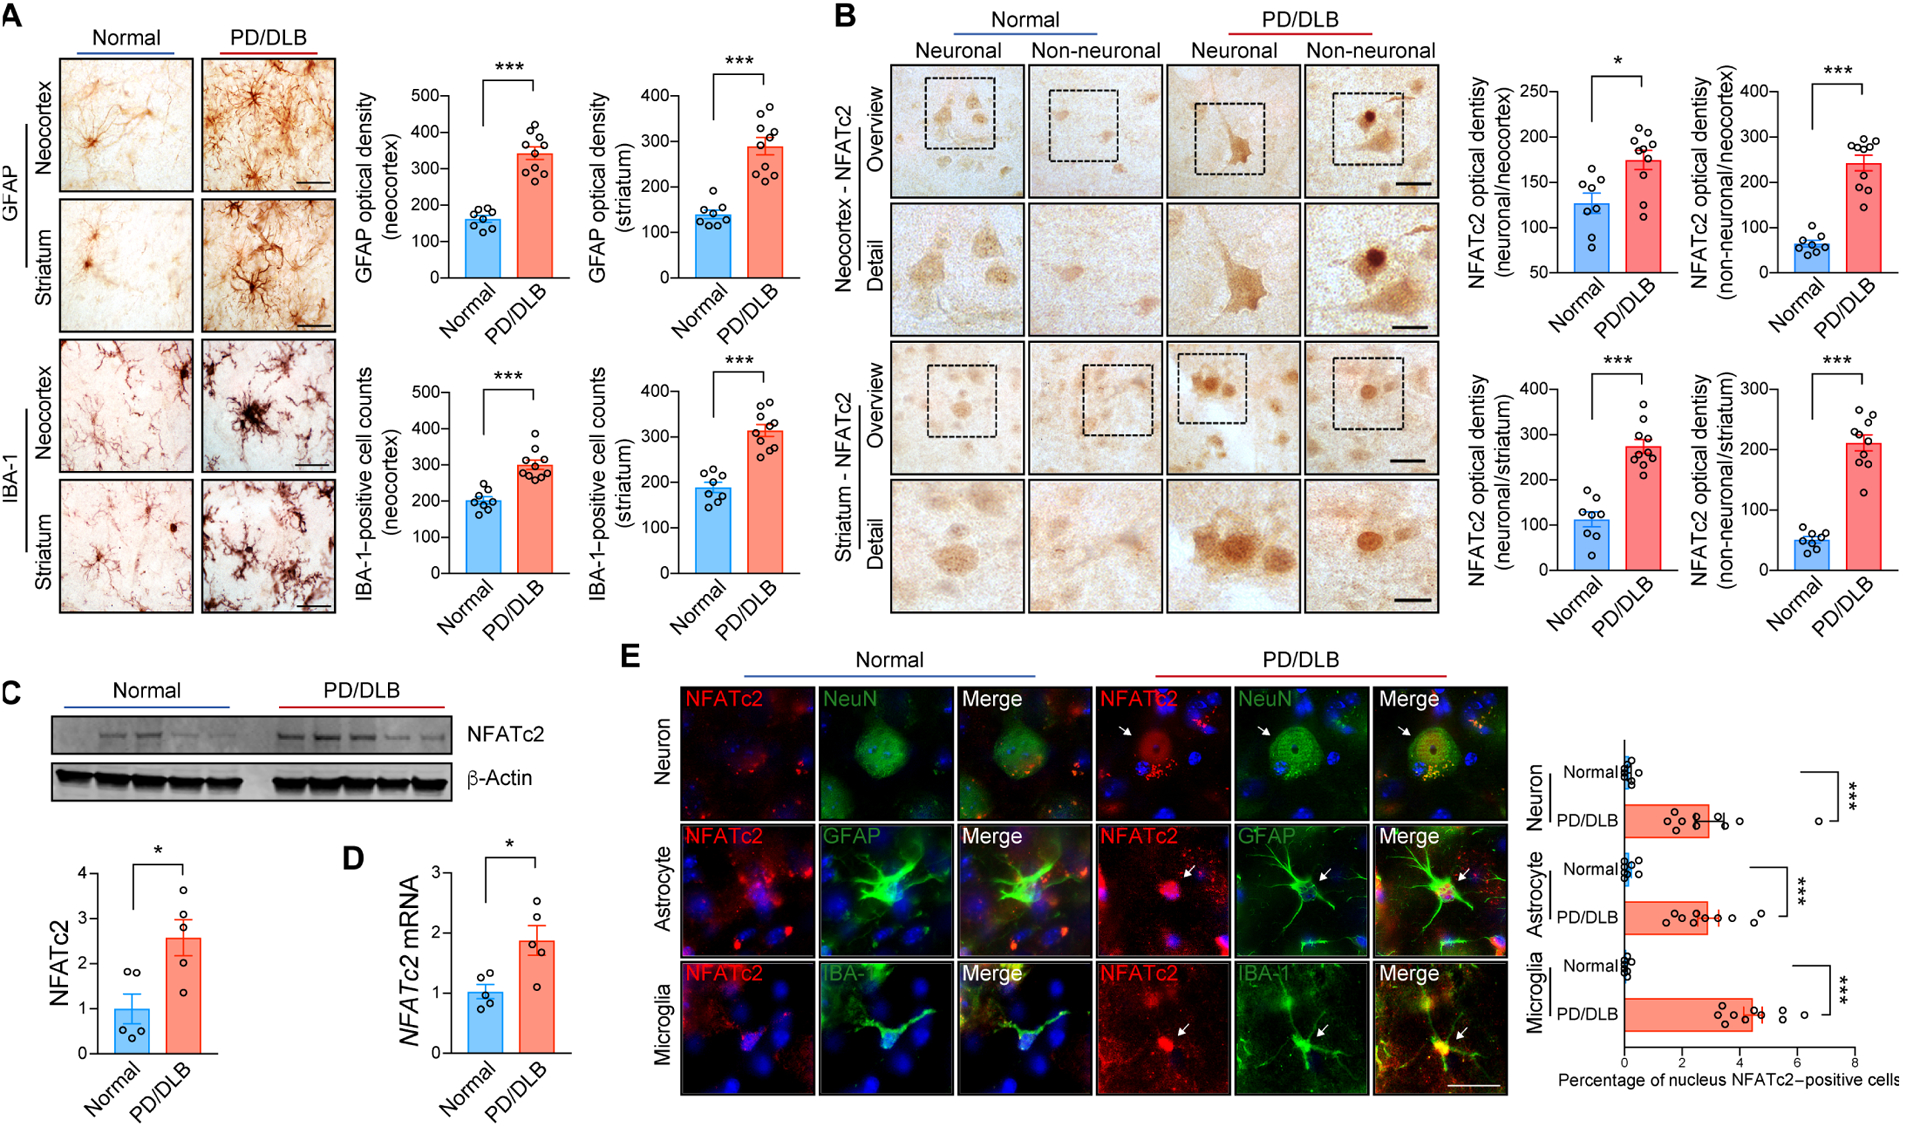
(A) Representative immunohistochemical analysis of astrogliosis and microgliosis in the neocortex and striatum of non-demented control and patients with PD/DLB. GFAP and IBA-1 immunoreactivity were analyzed by optical density analysis. Data are means ± SEM. ***P < 0.001 (unpaired two-tailed Student’s t test). n = 8 for control group and n = 10 for PD/DLB group. Scale bar, 10 μm. (B) Representative immunohistochemistry analysis of NFATc2 in the neocortex and striatum of non-demented control and patients with PD/DLB. NFATc2 immunoreactivity was analyzed by optical density analysis. Data are means ± SEM. *P < 0.05 and ***P < 0.001 (unpaired two-tailed Student’s t test). n = 8 for control group and n = 10 for PD/DLB group. Scale bars, 20 μm (low magnification) and 10 μm (high magnification). (C) Western blot analysis of human brain lysates, probed with NFATc2 and β-Actin. NFATc2 band intensity was determined by densitometric quantification and normalized to β-Actin. Data are means ± SEM. *P < 0.05 (unpaired two-tailed Students t test). n = 5 per group. (D) Human NFATc2 expression was determined by quantitative PCR. Data are means ± SEM. *P < 0.05 (unpaired two-tailed Students t test). n = 5 per group. (E) Representative images of double immunostaining for NFATc2 with neuron (NeuN), astrocyte (GFAT), or microglia (IBA-1) markers in human postmortem neocortex. Nuclear NFATc2 fluorescence immunoreactivity in each cell were analyzed. Data are means ± SEM. ***P < 0.001 (unpaired two-tailed Student’s t test). n = 8 for control group and n = 10 for PD/DLB group. Scale bar, 10 μm.