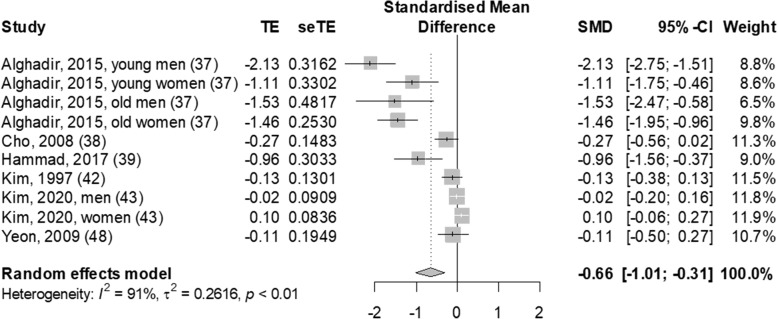
Fig. 2.
Forest plot of association between sugar-sweetened beverage consumption and bone mineral density in adults. SMD, standardized mean difference; 95% CI, 95% confidence interval; W weight. Numbers within brackets correspond to the citation number of the study. Squares and horizontal lines represent the effect size and 95% CI for individual studies, and the area of each square is proportional to the study's weight in the meta-analysis. Diamond and dashed vertical lines represent the overall effect size and 95% CI in the meta-analysis. The I2 and P values for heterogeneity are shown

