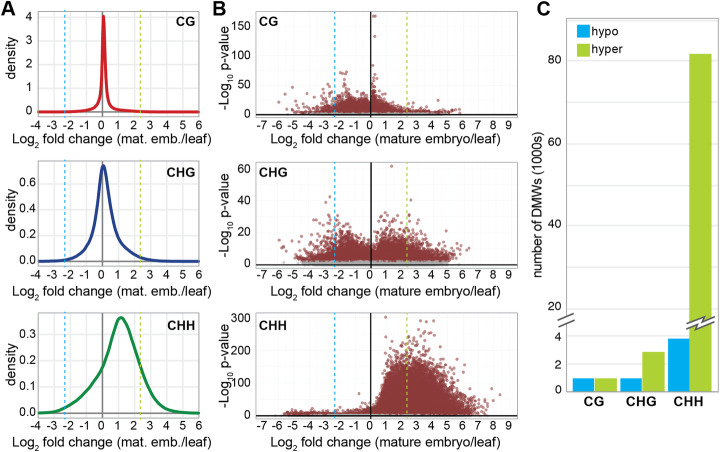
Fig. 3.
Identification of embryo differentially methylated windows. Density distributions (a) and volcano plots (b) of methylation fold change in mature embryos versus leaf for three cytosine contexts; 300-nt windows with a read depth of at least 5 are plotted (650,665 CG, 686,741 CHG, and 869,526 CHH windows). The dashed blue line marks 5-fold hypomethylation, and the dashed green line marks 5-fold hypermethylation. Windows above this threshold with an FDR-adjusted p value <0.005 were collected for subsequent DMW analysis. c Number of differentially methylated windows (DMWs) passing the above thresholds in each methylation context

