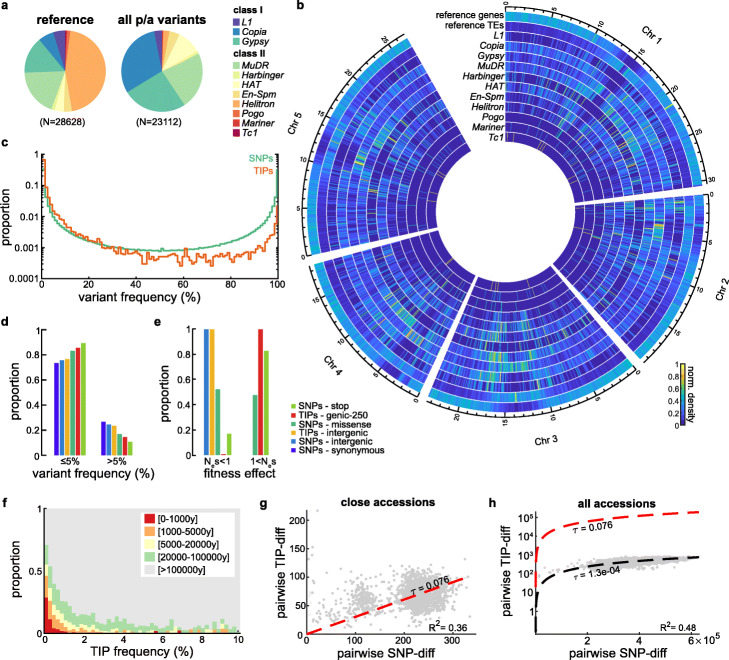
Fig. 1.
Recent TE mobilization at the species level. a Relative proportion of the 11 major TE superfamilies identified in the reference genome (TAIR10) and their respective contribution to TE insertion polymorphisms (TIPs). b Density of TIPs across the genome for each superfamily compared to the distribution of genes or TEs annotated in the reference genome. c Folded frequency spectrum of TIPs and biallelic SNPs. d Proportion of each variant category at frequencies below 5% and above 5%. e Distribution of fitness effects of each variant category as effectively neutral (Nes < 1) and deleterious (1 < Nes). f Frequency distribution of non-private TIPs by local haplotype age. g Pairwise differences in TIPs and SNPs between accessions diverging by < 500 SNPs. Regression line and confidence intervals are indicated in red and gray, respectively. h Pairwise differences in TIPs and SNPs between all accessions. Regression lines between all and closely related accessions are shown in black and red, respectively

