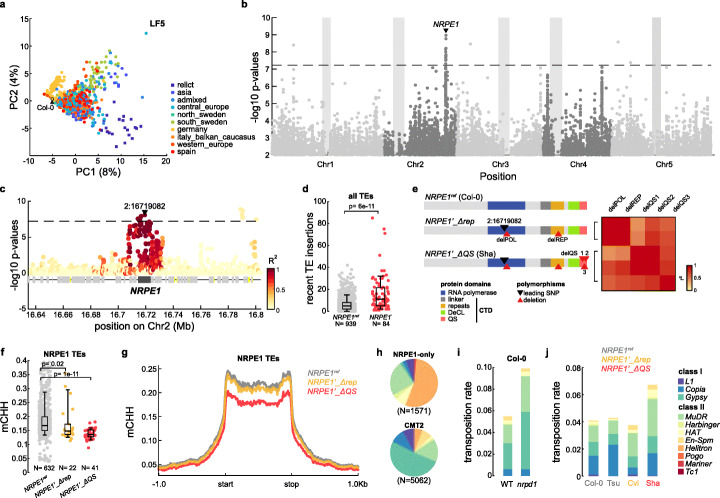
Fig. 2.
Genetic basis of variable transposition. a PCA of mobilome composition based on very recent TIPs (MAF lower than 5%). Different genetic groups are indicated in colors. b Manhattan plot of GWAS for very recent genome-wide TE mobilization. Dashed line represents the Bonferroni-corrected threshold for significance. c Detailed Manhattan plot within 80 kb around NRPE1 locus. Colors indicate the extent of linkage disequilibrium (R2) with the leading SNP (black triangle). d Boxplot of numbers of very recent TE insertions in carriers of the reference NRPE1ref and derived NRPE1’ alleles. The p value of a Wilcoxon test between distributions is indicated. e Alleles and polymorphisms at NRPE1 locus and the linkage between their closest tagging SNPs. f, g Boxplot and metaplot of CHH methylation on NRPE1-dependent TEs within carriers of the derived NRPE1’_ΔQS allele, carriers of the derived NRPE1’_Δrep allele, and a set of 100 randomly sampled carriers of the reference NRPE1ref allele. The p values of Wilcoxon tests between distributions are indicated. h Composition by superfamily of NRPE1- or CMT2-targeted TE sequences. i Transposition rates in 1000 offspring of WT and nrpd1 parents of the Col-0 accession grown under standard conditions. j Transposition rates in 1000 offspring of the Cvi-0, Sha, Tsu-0, and Col-0 accessions derived from parents grown under standard conditions

