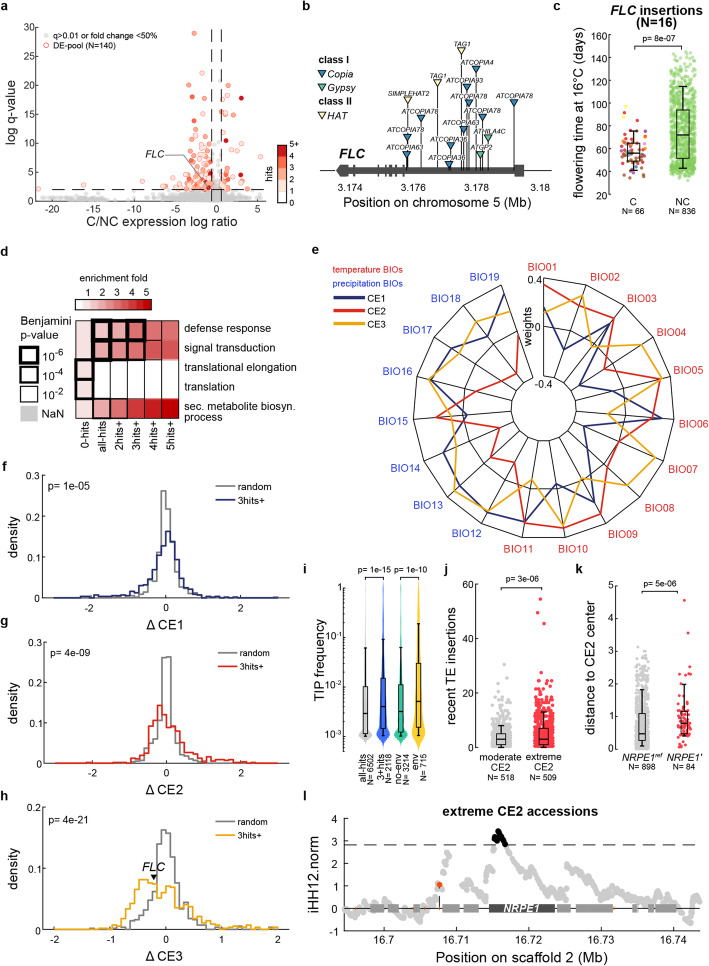
Fig. 5.
Contribution of transposition to local environmental adaptation. a Significance against log-ratio of combined transcriptomic effects of TE insertions within or near (< 250 bp) genes in carrier accessions (C) compared to non-carrier accessions (NC). The number of TE insertions found for each locus is indicated as a shade of red. b Location and identity of the 16 TE insertions detected within FLC. c Flowering time at 16 °C of carrier accessions (C) and non-carrier accessions (NC) of FLC TE-insertions. The p value of Wilcoxon test is indicated. d Top 5 GO enrichment terms across genes never visited or visited once or more. e Weights across 19 bio-variables of 3 first climatic envelopes (CEs) in PCA of 1047 accessions. f–h Distributions of climatic envelope shifts (ΔCEs) observed between carriers and non-carriers of TE insertions for each of the 566 genes hit 3 times or more compared to the distribution of ΔCEs with the same numbers of randomly selected carriers. The p values of Kolmogorov-Smirnov comparisons between observed and random distributions are indicated. i Frequency of TE insertions found within or near genes visited (all-hits), visited 3 times or more (3hits+), in association with a CE shift (env) or not (no-env). The p values of Wilcoxon tests between distributions are indicated. j Boxplot of numbers of very recent TE insertions in extreme or moderate CE2 accessions. The p values of Wilcoxon tests between distributions are indicated. k Boxplot of distance to CE2 center (absolute z-scored CE2) for carriers of the reference NRPE1ref and derived NRPE1’ alleles. The p values of Wilcoxon tests between distributions are indicated. l iHH12 values in extreme CE2 accessions (upper and lower quartiles of CE2.z) across the NRPE1 region with in black indicated values above the genome-wide 1% threshold (dashed line)

