
Fig. 3. Exhausted SARS-CoV-2-reactive CD8+ T cells are increased in mild COVID-19 illness.
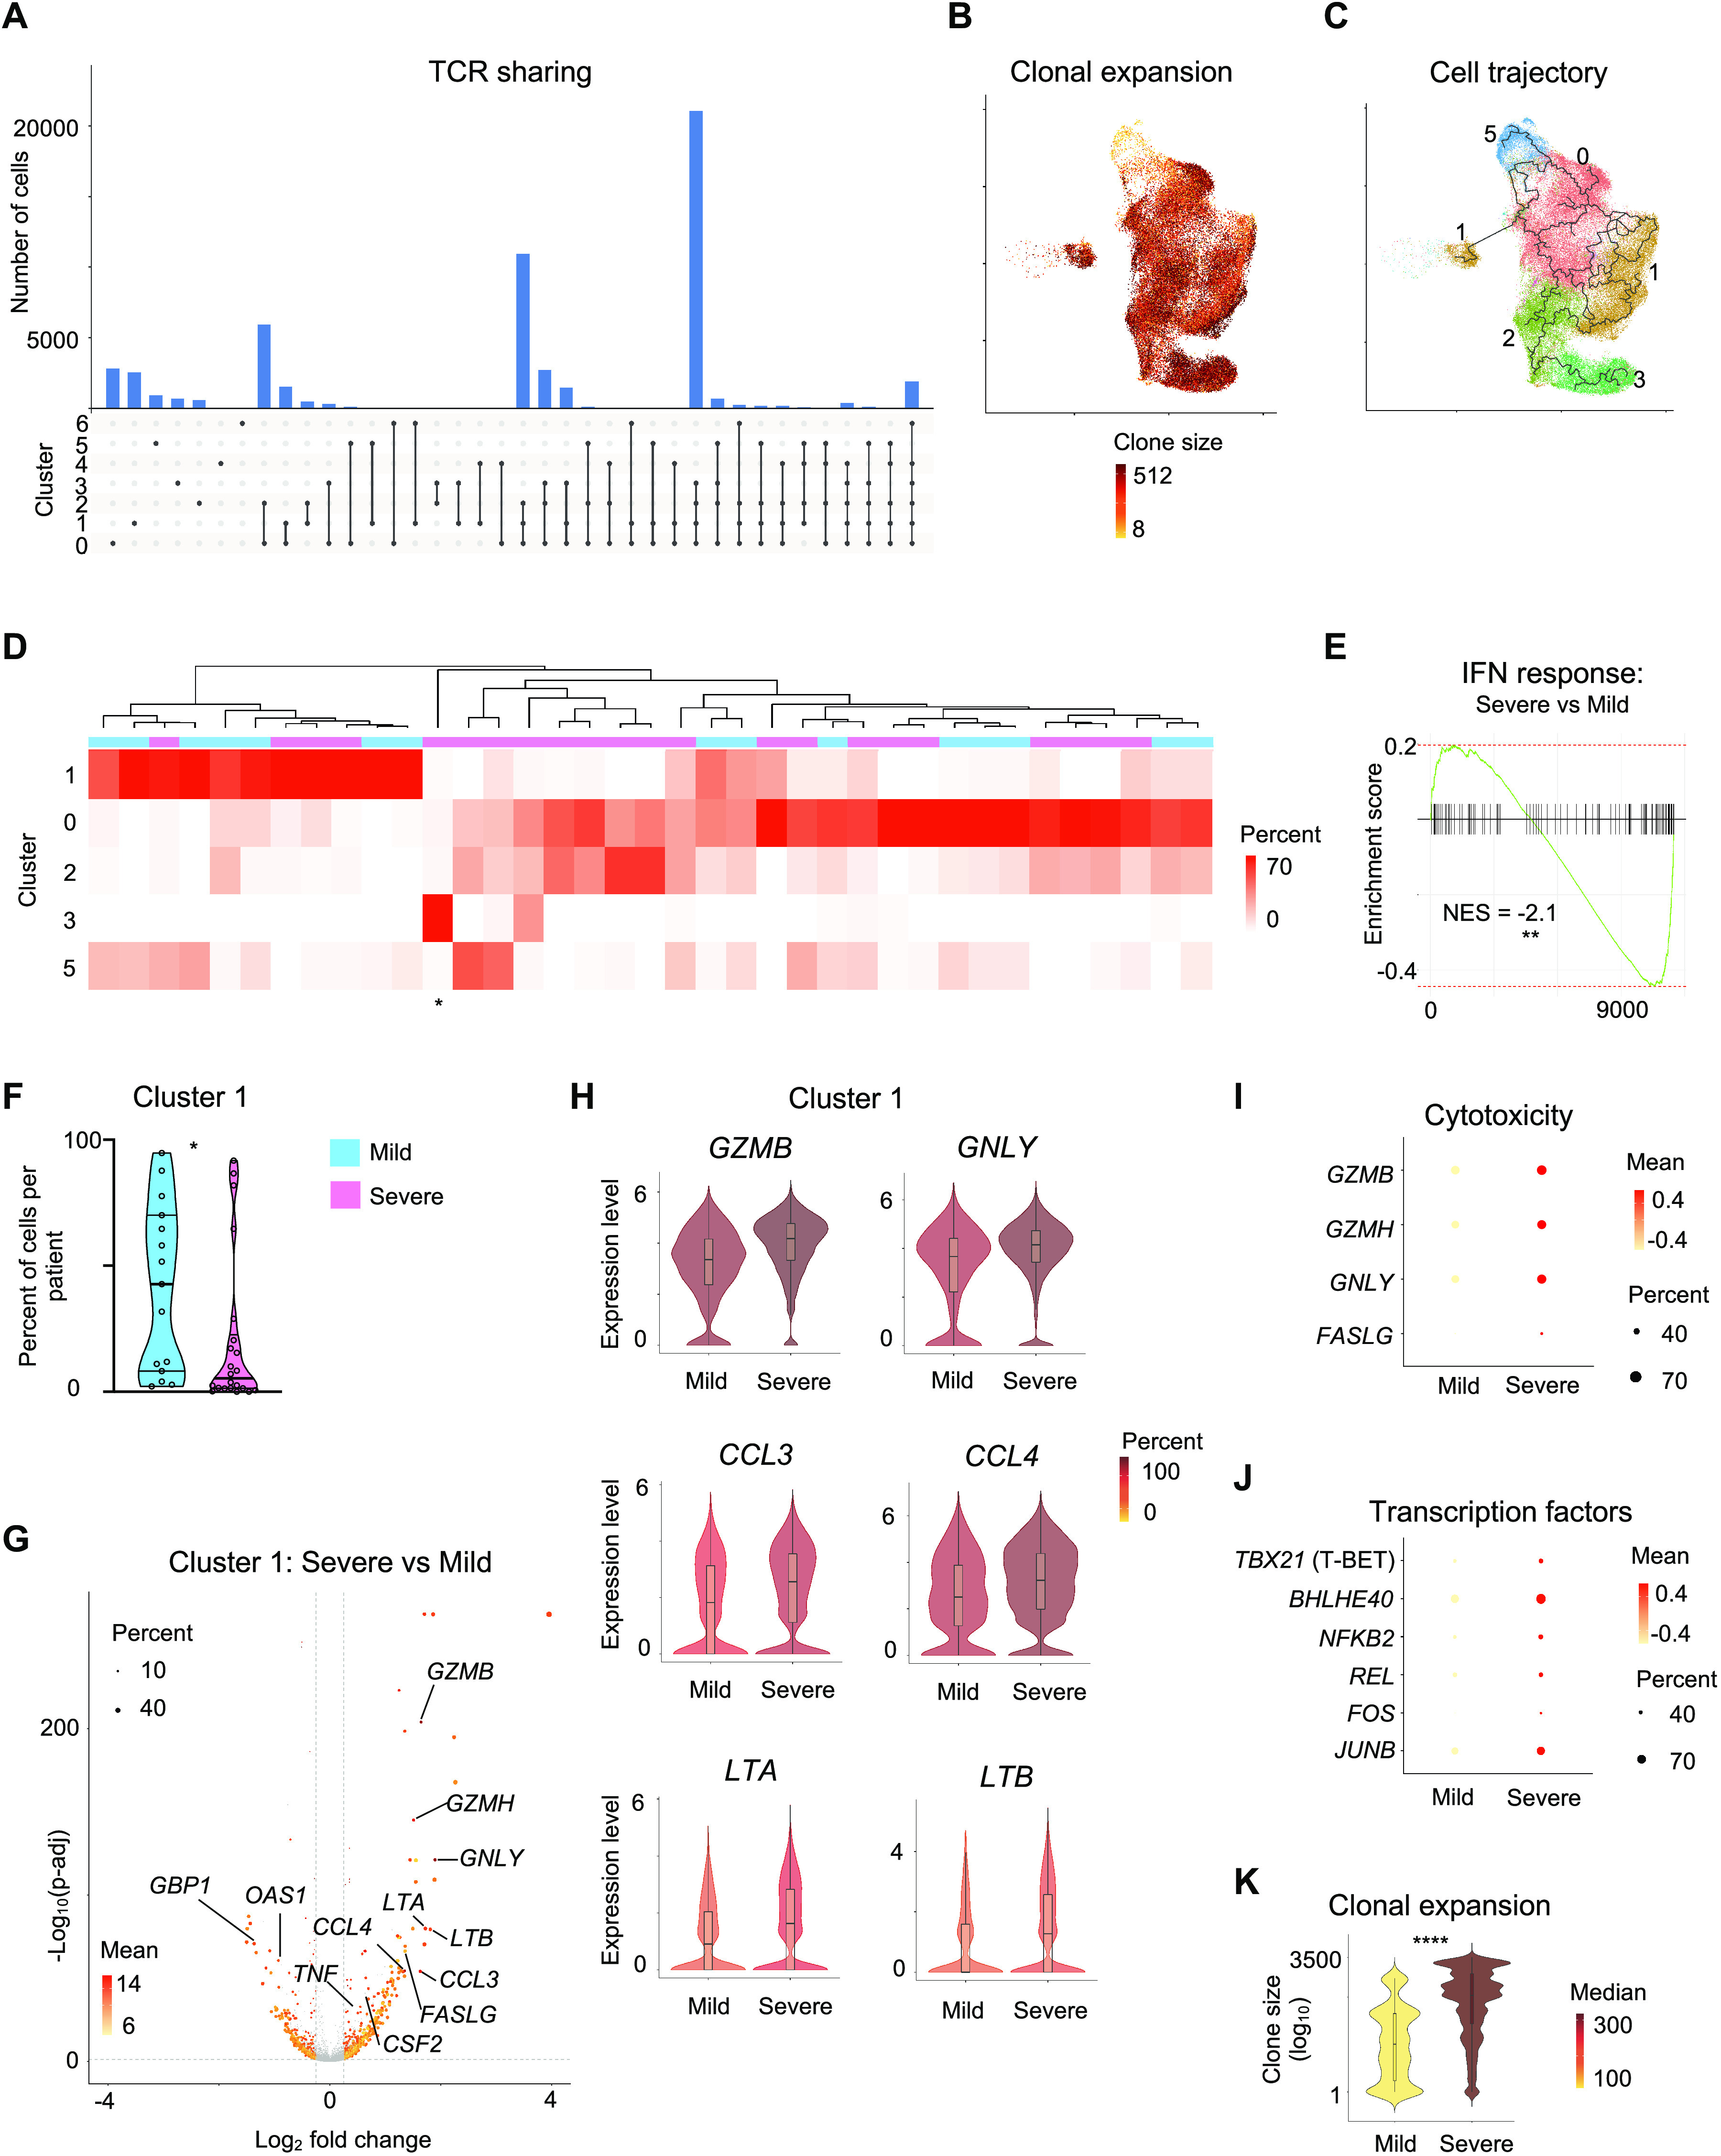
(A) Single-cell TCR sequence analysis of SARS-CoV-2-reactive cells showing the sharing of TCRs between cells from individual clusters (rows, connected by lines). Bars (top) indicate the number of cells intersecting indicated clusters (columns). (B) UMAP is showing the clone size of SARS-CoV-2-reactive cells from COVID-19 patients. (C) Single-cell trajectory analysis showing the relationship between cells in different clusters (line). (D) Unsupervised clustering of all COVID-19 patients (mild and severe illness) based on the proportion of SARS-CoV-2-reactive CD8+ T cells present in each cluster per patient. The symbol * below represents patient 8. Clusters 4, 6, and 7 that had a very low frequency of cells in COVID-19 patients (<1% cells per cluster in total) are not shown here; full details provided in table S3. (E) Gene Set Enrichment Analysis (GSEA) of type I interferon response genes in all cells from COVID-19 patients with severe versus mild illness. Normalized Enrichment Score (NES) = -2.1, ** P<0.01. (F) Violin plots comparing the proportion of cells in cluster 1 from COVID-19 patients with mild and severe illness. Data are displayed as median with interquartile ranges (n=37, 2 subjects without hashtag data were not included for donor-specific analysis). (G) Volcano plot showing genes differentially expressed (adjusted P < 0.05, mean CPM >0, log2 fold change >0.25) in cluster 1 cells between COVID-19 patients with severe and mild disease. (H) Violin plots comparing the normalized expression level (log2(CPM+1)) of indicated transcripts in cluster 1 cells between COVID-19 patients with mild and severe disease. Color indicates percentage of cells expressing indicated transcript. (I) Plot displaying the mean expression (color scale) and percent of expressing cells (size scale) of several cytotoxicity molecules in cluster 1 cells from COVID-19 patients with severe and mild illness. (J) Plot displaying the mean expression (color scale) and percent of expressing cells (size scale) of several key transcription factors in cluster 1 cells from COVID-19 patients with severe and mild illness. (K) Violin plots showing the degree of CD8+ T cell-clonal expansion in cluster 1 cells between COVID-19 patients with mild and severe disease. Color indicates median size per group. * P<0.05, ****P<0.0001 by Mann-Whitney tests (F, K).