
Figure 5.
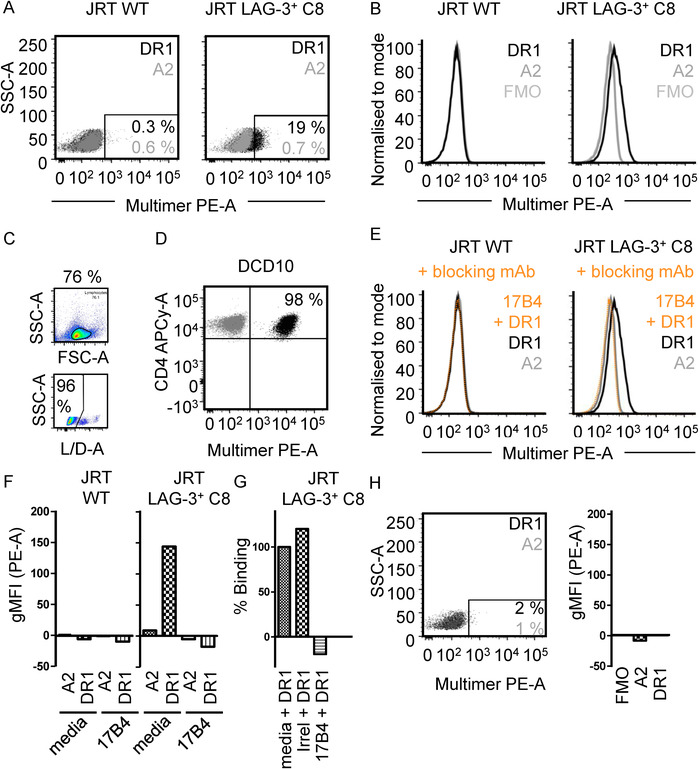
(A) 2D Flow cytometry plots of pHLA‐multimer staining of JRT WT cells (left) and JRT LAG‐3+ C8 cells (right) with pHLA‐A*02:01 multimers (grey) or pHLA‐DR1 multimers (black). Inset numbers = percentage multimer+ cells. Data are representative of three independent experimental repeats with one sample per experiment. (B) Flow cytometry histograms of pHLA‐multimer staining as in (A). Geometric mean fluorescent intensity (gMFI) values are indicated in the inset. Data are representative of three independent experimental repeats with one sample per experiment. (C) Example gating strategy of lymphocyte gate and live L/D‐A‐ cells used for all flow cytometry analysis. Example shown is JRT LAG‐3+ C8 cells stained with pHLA‐DR1 multimers. (D) 2D Flow cytometry plot of cognate CD4+ T cell clone (DCD10) staining with pHLA‐DR1 multimers used in experiments described. Cognate (DR1PKY) and irrelevant (DR1irrel) multimer stains are shown. Data are representative of two independent experimental repeats with one sample per experiment. (E) Flow cytometry histograms of pHLA‐multimer staining of JRT WT cells (left) and JRT LAG‐3+ C8 cells (right) stained with pHLA‐DR1 multimers pre‐blocked with unconjugated anti‐LAG‐3 mAb clone 17B4 (orange; dashed) or media control (black). Data are representative of two independent experimental repeats with one sample per experiment. Data shown in (B) and (E) were performed as a single experiment and are depicted separately for clarity. (F) FMO subtracted quantification of gMFI in experiments described in (E). Data are representative of two independent experimental repeats with one sample per experiment. (G) Quantification of pHLA‐DR1 binding to JRT LAG‐3+ C8 cells pre‐incubated with control (media), irrelevant mAb (irrelevant; anti‐CD4) or anti‐LAG‐3 mAb (17B4). Percentage binding normalized to background subtracted gMFI observed for control blockade of pHLA‐DR1 binding. Data are representative of two independent experimental repeats with one sample per experiment. (H) Left: 2D Flow cytometry plots of pHLA‐II‐multimer staining of LAG‐3‐ CD4+ MOLT‐3 cells with pHLA‐A*02:01 multimers (grey), or pHLA‐DR1 multimers (black). Inset numbers = percentage multimer+ cells, color coded as described. Data are representative of two experimental repeats with one sample per experiment. Right: Staining of LAG‐3‐ CD4+ MOLT‐3 cells with either pHLA‐A*02:01 or pHLA‐DR1 multimers. Data are a representative of two experimental repeats with one sample per experiment. All data in graphs are single gMFI values from a representative example experiment.