
Figure 4. Glomerular NPHS1 mRNA expression in NEPTUNE cohort.
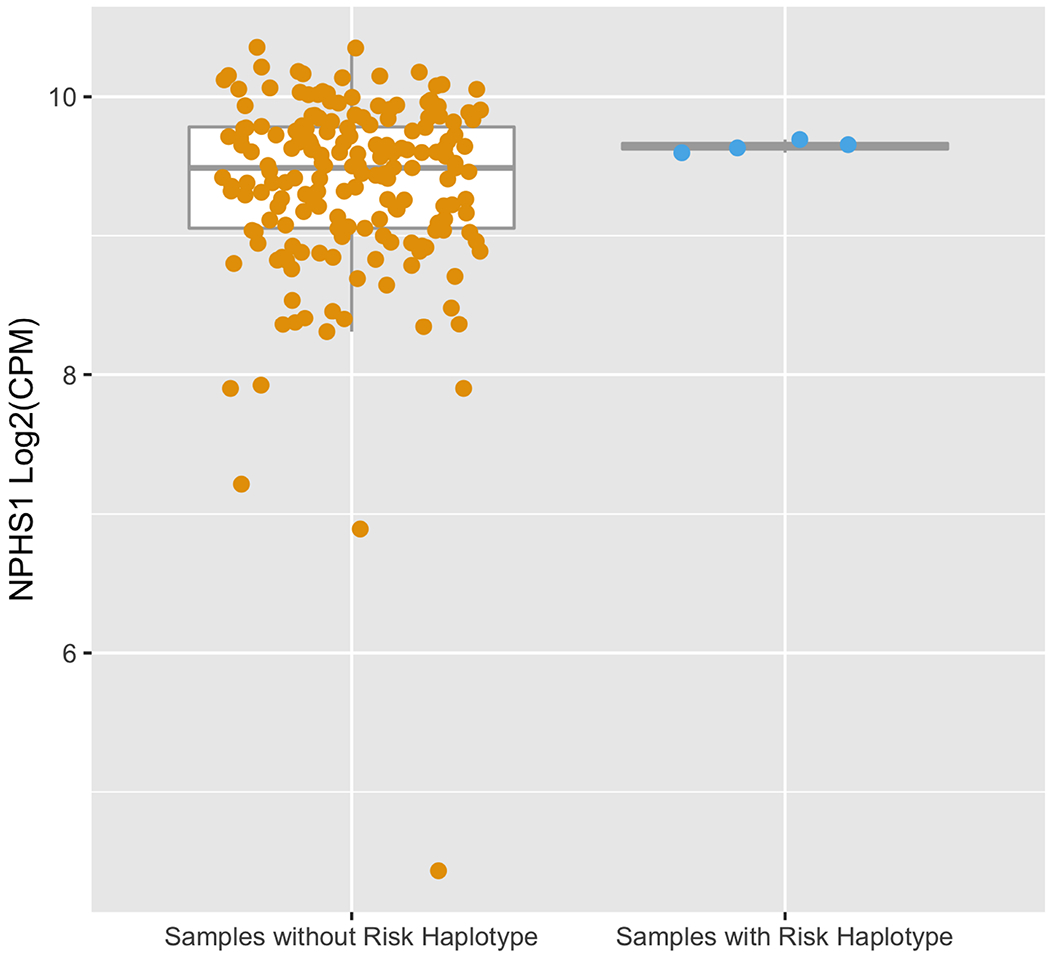
(A) NPHS1 fragments per kilobase million (FPKM) expression comparing samples withand without NPHS1 risk haplotype. Samples with the NPHS1 risk haplotype do not show significantly different expression levels (Wilcox test p=0.39).
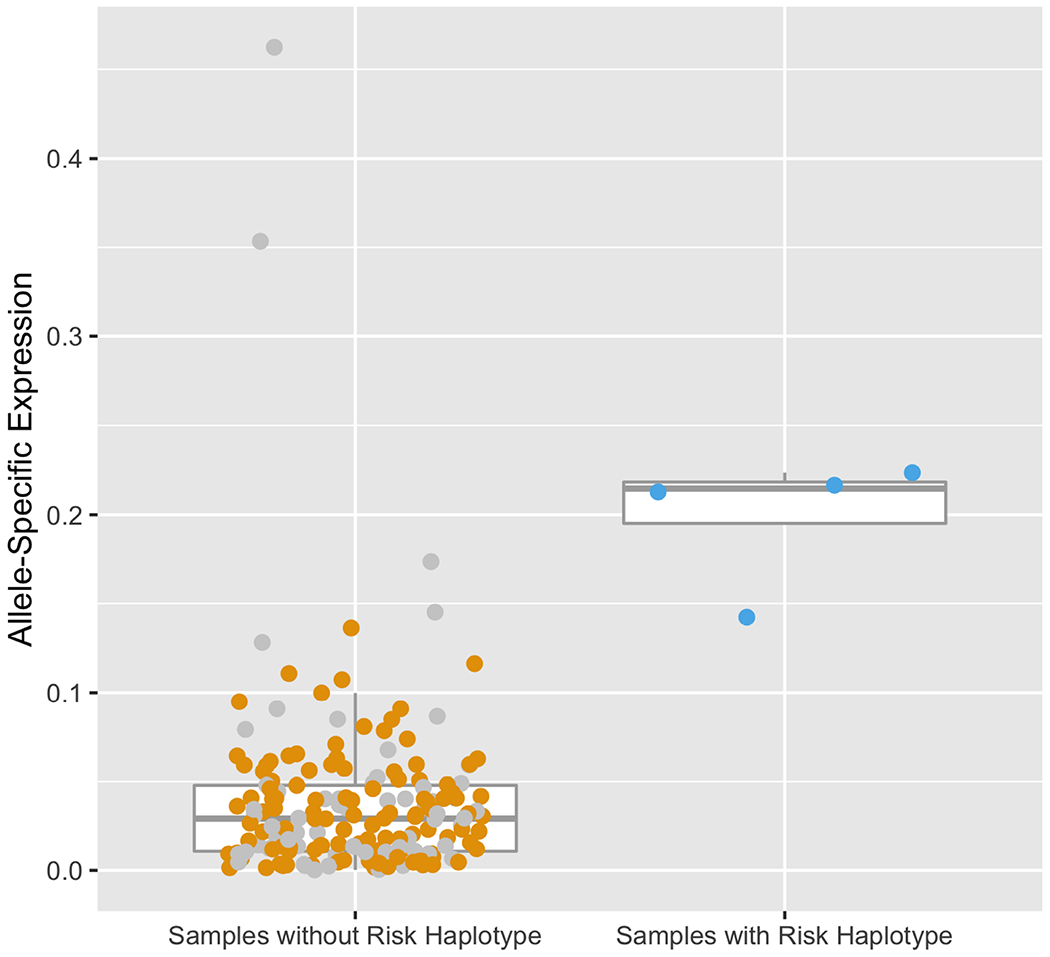
(B) Allele-specific expression (ASE) comparing samples with and without NPHS1 risk haplotype. ASE = |0.5 − (haplotype A / total reads)|. In patients with the risk alleles, haplotype A harbors all five NPHS1 risk variants, in patients without the risk haplotype, haplotype A is randomly selected from one of their two haplotypes. Sample with less than two heterozygous SNPs or in the bottom 10% of total counts are indicated in gray. Samples with the NPHS1 risk haplotype show significant allele specific expression with lower expression of the risk haplotype (Wilcox test p=9.3E-4).