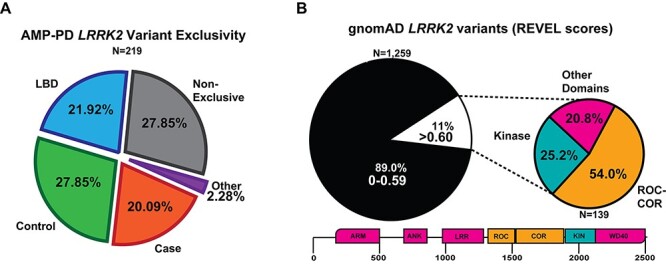
Figure 6.

Summary of LRRK2 variant discoveries from both AMP-PD and gnomAD. (A) Pie chart showing the distribution of the 219 LRRK2 variant in case (PD), control, LBD or multiple participants from each group, ‘Non-exclusive’ from AMP-PD. ‘Other’ refers to either MSA-exclusive (N = 2, p.R924C and p.A75G), PSP (N = 1, p.K657I) and prodromal PD (N = 2, p.S1096C and p.T146S). Case-only (PD) variants are listed in Supplementary Material, Table S4. (B) Pie chart showing the portion of LRRK2 variants from gnomAD with less REVEL score ≤0.599 (black) or ≥0.6 (white). Smaller pie chart represents the distribution of location within LRRK2 for variants that are at or exceed the REVEL score of 0.6 in gnomAD (N = 139). List of gnomAD variants > 0.6 are described in Supplementary Material, Table S8.
