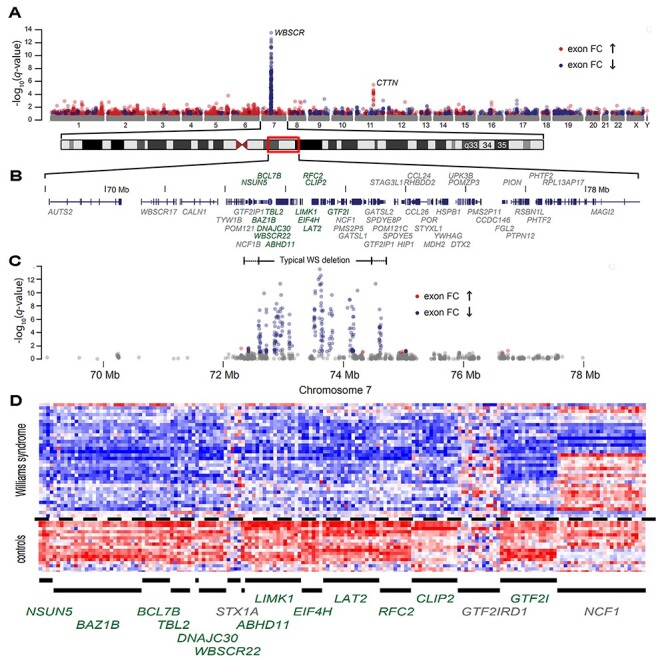
Figure 1.

Manhattan plot of genome-wide differential expression in lymphoblastoid cells. (A) −log10q-value (the adjusted P-value using the Benjamini–Hochberg method) by chromosomal location for 304 572 detected exons from 34 WS subjects with typical deletions versus 18 controls. (B) RefSeq track at chr.7: 68 500 000–78 500 000 (Hg18) with differentially expressed transcripts (see Table 1) shown in green. (C) Exon-level differential expression in this chromosome 7 region for 34 WS subjects with typical deletions. The dashed line is at a FDR value of 0.05 (−log10q-value = 1.3), such that the expected proportion of false discoveries in exons above this threshold is controlled to be less than 5%. (D) Individual exon-level relative intensities for 13 differentially expressed genes plus three genes (STX1A, GTF2IRD1 and NCF1) without gene-level evidence of differential expression (see Table 1). Exons are binned in chromosomal order by gene (columns) and by individual (rows) for 18 controls and 34 typical WS deletions.
