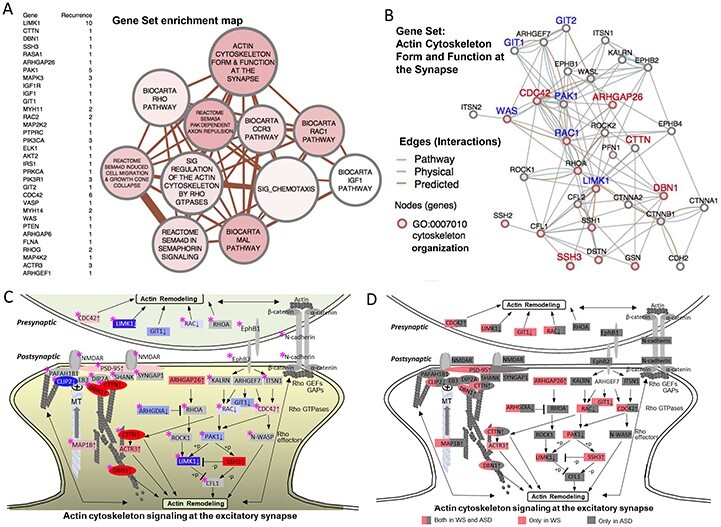
Figure 5.

GSEA reveals dysregulation of actin signaling networks. (A) A gene set enrichment list of genes shared by the top 30 gene sets, ranked by their level of differential expression is shown to the left of the network. In the map of the gene sets to the right, nodes represent gene set clusters that result from the χ2-test for gene set enrichment (Supplementary Material, Table S5) and edges represent the gene overlap between sets. Nodes are colored by χ2 values, node size indicates the number of genes in the set and edge thickness indicates number of genes shared between sets. (B) WS DEG (FDR < 0.2) pathway showing physical and predicted interaction network for the top-scoring GSEA gene set, ‘Actin cytoskeleton form and function at the synapse,’ GO term association (2 × 10⁻¹³, ‘actin cytoskeleton organization’). (C) WS DEG GSEA gene set (from B) shows unexpected match to the excitatory dendritic spine, capturing systems that regulate cytoskeleton in response to receptor excitation. Diagram is modified from Dillon and Goda (37), updated to include recent evidence for microtubule co-regulation involving WS genes. Node labels identify WS DEGs. Node colors and density indicate WS DEG intensity by rank (FDR < 0.2) (blue = decreased, red = increased), or non-detected as a WS DEG (gray). WS region genes (LIMK1 and CLIP2) are shown with white text in blue shade. Note the growth ends of actin (barbed) and microtubules (plus) form a coregulatory bridge to the NMDAR, which includes WS DEG’s Drebrin 1 (DBN1, rank 20/12122) and cortactin (CTTN, rank 12), major cytoskeletal regulators in adult spines and axonal growth cones (47,48). The bridge complex represents experimentally established components that connect CLIP2 to the NMDAR through PAFAH1B1 (99) and independently through direct MT plus end binding of CLIP2 to EB3 (49), through DIP2A (100), DNB1 and CTTN, to SHANK-PSD95. ACTR3 is a major constituent of the actin branching complex ARP2/3 that is regulated by both CTTN (101), and MAP1B (102) (binds both MT and actin), both of which were significantly over-expressed in WS (Supplementary Material, Table S3). The relationship of WS DEG’s to ASD risk genes (Supplementary Material, Table S11) taken from the literature is noted (pink star), shows a striking synergism, complementarity and overlap, suggesting that WS, caused by a small gene set, may define the excitatory dendritic spine and its gene networks as a common brain substrate for the disturbed behavioral systems involved in approach or avoidant social behaviors seen in WS and ASD, where the large number of genes and networks has precluded identifying these. (D) Duplicate of (C) showing WS genes in pink and ASD in gray or both (half pink and half gray).
