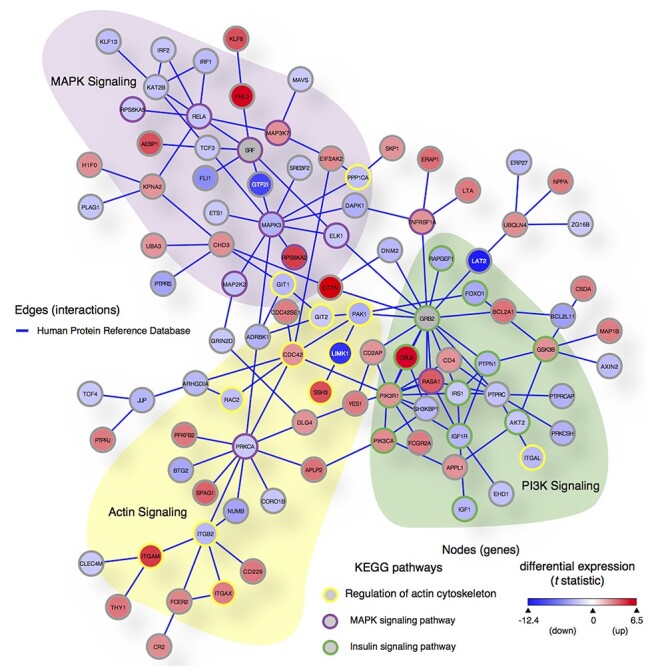
Figure 6.

PPI network of DEGs implicates three core networks disturbed in WS; 100 genes (nodes) and 137 direct PPI (edges) from HPRD (release 9) are among the 673 DEGs in WS (FDR < 0.2) plus WS deleted genes and two seed proteins (SRF and GRB2) known to directly interact with two WS genes (GTF2I and LAT2). We used SAGA (41) to query this PPI graph against the KEGG Human pathways database. Node color is scaled by differential expression (scale bar in lower right corner from moderated t statistic between −12.4 and 6.5, from blue to red) and node border is colored by KEGG pathways: purple = MAPK signaling pathway (hsa04010), yellow = regulation of actin cytoskeleton (hsa04810) and green = insulin signaling pathway (hsa04910). Three WS region genes retrieved in this network (GTF2I, LIMK1 and LAT2) are shown with white node labels.
