Figure 5.
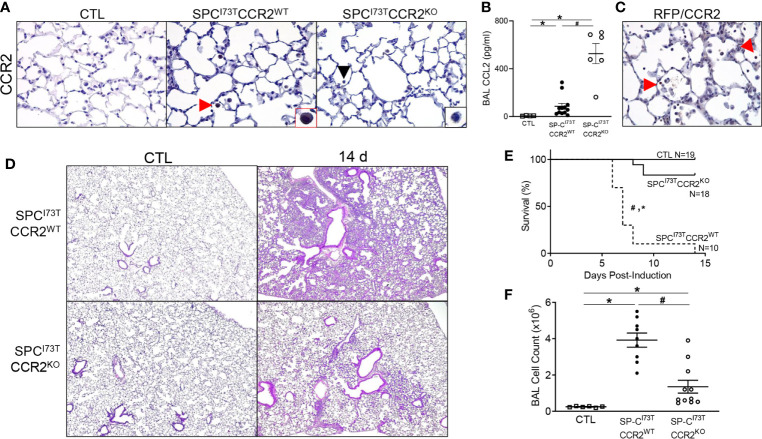
Effects of genetic CCR2 monocyte ablation on lung injury, survival and inflammation following SP-CI73T mutant induced injury. (A) Immunohistochemical analysis of control (CTL, tamoxifen treated SP-CWT or oil treated SP-CI73T mice), SP-CI73TCCR2WT and SP-CI73TCCR2KO lung sections were immunostained with antibody to CCR2. Red arrowheads indicate myeloid cells staining for CCR2. Insets show magnified cells; box color matches that of respective arrowhead. Black arrowheads indicate negative CCR2 staining in mononuclear cells in SP-CI73TCCR2KO cohorts. Images shown are representative of 3-5 animals per group. Magnification: 400x. (B) CCL2 ELISA of BAL fluid from control (CTL, tamoxifen treated SP-CWT or oil treated SP-CI73T mice), SP-CI73TCCR2WT and SP-CI73TCCR2KO mice 14 d following tamoxifen administration. Data are represented as mean ± SEM (N=4-13). (C) Histochemical analysis of SP-CI73TCCR2RFP lung sections 14 d post injury immunostained with antibody to RFP/CCR2. Arrowheads indicate cells expressing the receptor (D) Hematoxylin & Eosin stained sections of control (CTL, tamoxifen treated SP-CWT, CCR2KO, or oil treated SP-CI73T mice), SP-CI73TCCR2WT and SP-CI73TCCR2KO lungs 14 d post injury. Magnification: 400x. (E) Kaplan–Meier survival analysis from control (tamoxifen treated SP-CWT or oil treated SP-CI73T mice) SP-CI73TCCR2WT and SP-CI73TCCR2KO. Mice found dead or displaying body weight loss equating >25% of stating weigh for 2 consecutive days. *p<0.05 compared to control mice; #p<0.05 compared to SP-CI73TCCR2WT mice by Log-Sum (Mantel-Cox) Rank test. (F) BAL fluid cell counts from control (CTL, tamoxifen treated SP-CWT or oil treated SP-CI73T mice), SP-CI73TCCR2WT and SP-CI73TCCR2KO (N =6-11) 14 d following SP-CI73T induced lung injury. Data are represented as mean ± SEM. *p<0.05 compared to control mice; #p<0.05 compared to SP-CI73TCCR2WT mice by One-Way ANOVA, using Tukey post-hoc test.

