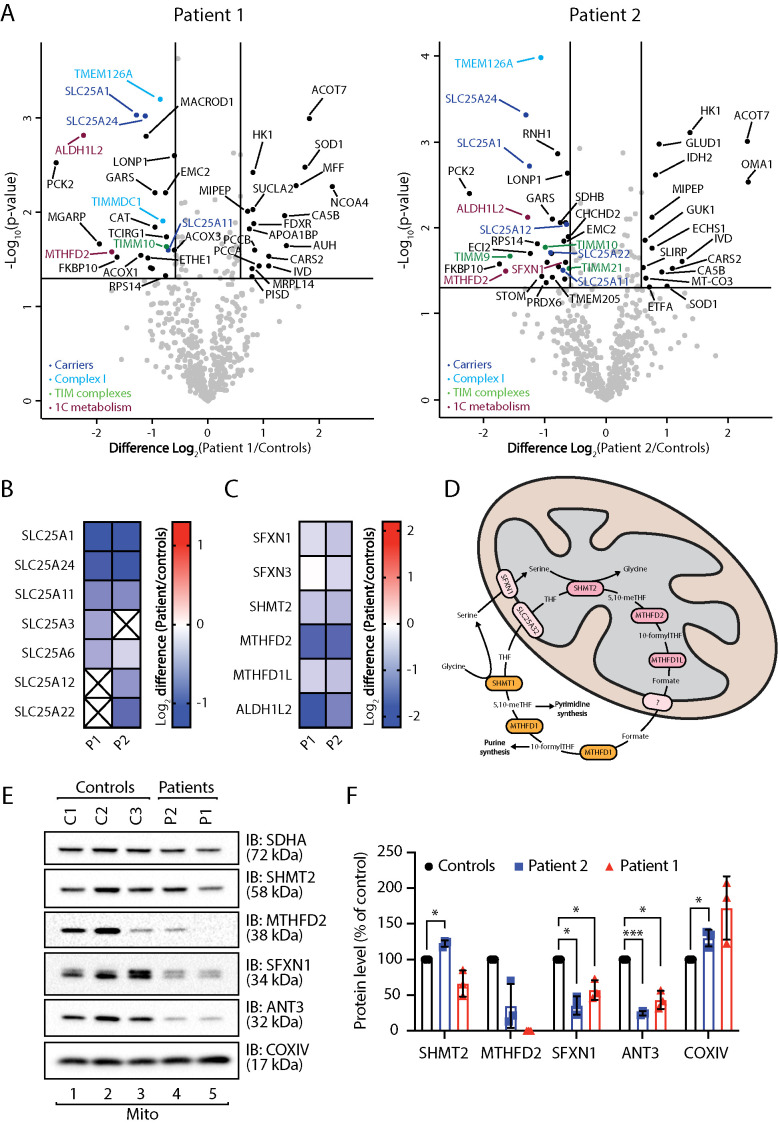
FIGURE 2:
Proteomic characterization of Sengers syndrome patient fibroblasts. (A, B) Mitochondria isolated from three independent control fibroblast cell lines and two Sengers patient fibroblast cell lines (Patient 1 [P1] and Patient 2 [P2]) were subjected to label-free mass spectrometric analysis. (A) Volcano plots depicting the relative levels of proteins in Sengers patient mitochondria compared with the averaged control data set. Significantly altered proteins are located outside the lines (p value: <0.05, fold change: >1.5× up or down). SLC25 members (dark blue), Complex I subunits or assembly factors (light blue), TIM complex subunits (green), and 1C metabolism proteins (plum) are indicated. (B) Log2 fold-change values (as compared with controls) with p < 0.05 are depicted for SLC25 family proteins in both patient fibroblast cell lines. (C) Log2 fold-change values (as compared with controls) are depicted for 1C metabolism proteins in both patient fibroblast cell lines. (D) Schematic depiction of 1C metabolism. 1C metabolism is a series of parallel and reversible reactions occurring in the mitochondria and the cytosol. In proliferating cells, the reaction proceeds such that formate is produced in the mitochondria and exported to the cytosol for use in biosynthetic reactions. (E) Mitochondrial lysates from control, Sengers syndrome Patient 1 and Patient 2 fibroblasts were analyzed by SDS–PAGE and Western blotting with the indicated antibodies. (F) The relative level of each protein was quantified and is represented as the mean ± SD (n = 3). One sample t test: *, p < 0.05, ***, p < 0.001.

