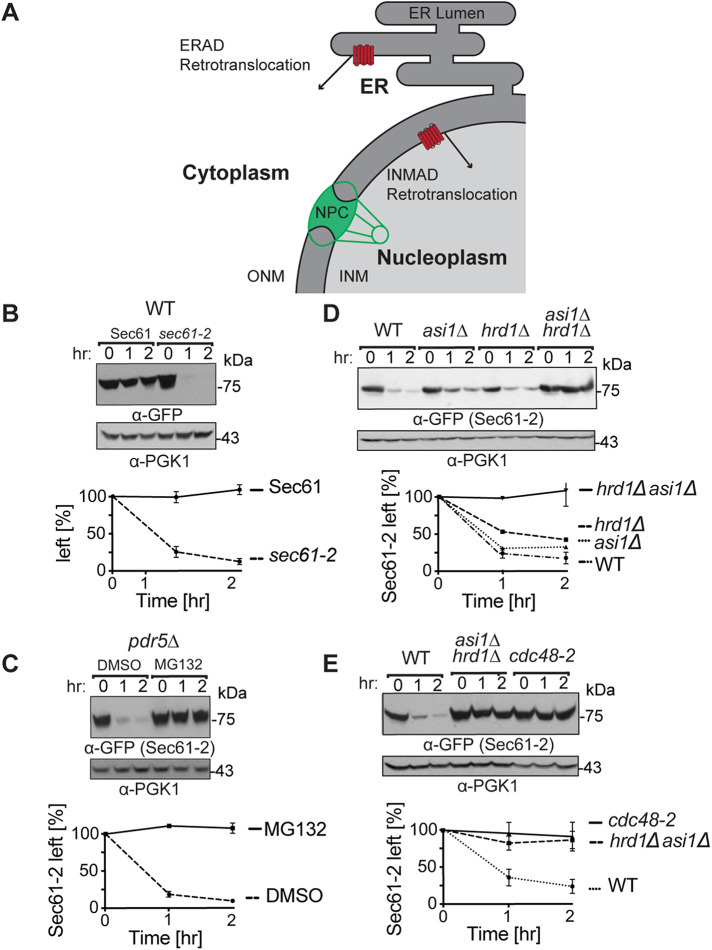
FIGURE 1:
Sec61-2-GFP is quality-control substrate of Hrd1 and Asi1. (A) Depiction of the contiguous ER and INM. A subset of ER proteins can diffuse through the nuclear pore complex (NPC) into the INM. Both the 26S proteosome and Cdc48 can access the nucleoplasm through nucleoporins, and cell physiology thus supports ERAD retrotranslocation into the cytoplasm and INMAD retrotranslocation into the nucleoplasm. (B) Sec61-GFP is stable, whereas sec61-2 GFP is a degraded. Isogenic strains expressing Sec61-GFP or Sec61-2-GFP were grown into log phase, and the degradation of each protein was measured using cycloheximide chase (CHX). After the addition of CHX, cells were collected and lysed at the indicated times. Lysates were analyzed by SDS–PAGE and immunoblotting with α-GFP and α-Pgk1. Densitometry was performed using ImageJ, and the α-GFP signal was normalized to α-Pgk1 signal. t = 0 was taken as 100% ,and data plotted are mean ± SD from three experiments. (C) Sec61-2-GFP is stabilized by the proteasome inhibitor MG132. A pdr5Δ strain expressing Sec61-2-GFP was grown into log phase and then treated with either MG132 (25 µg/ml) or DMSO. Degradation was then measured by CHX. After the addition of CHX, cells were collected and lysed at the indicated times. Lysates were analyzed by SDS–PAGE and immunoblotting with α-GFP and α-Pgk1. Data plotted are mean ± SD from three experiments. (D) Sec61-2-GFP degradation depends on both Hrd1 and Asi1. WT, hrd1Δ, asi1Δ, and hrd1Δasi1Δ strains expressing Sec61-2-GFP were subjected to CHX. After the addition of CHX, cells were collected and lysed at the indicated times. Lysates were analyzed by SDS–PAGE and immunoblotting with α-GFP and α-Pgk1. Data plotted are mean ± SD from three experiments. (E) Sec61-2-GFP degradation requires the Cdc48 ATPase. WT, hrd1Δasi1Δ, and retrotranslocation-deficient cdc48-2 strains expressing Sec61-2-GFP were subjected to CHX. After the addition of CHX, cells were collected and lysed at the indicated times. Lysates were analyzed by SDS–PAGE and immunoblotting with α-GFP and α-Pgk1. Data plotted are mean ± SD from three experiments.

