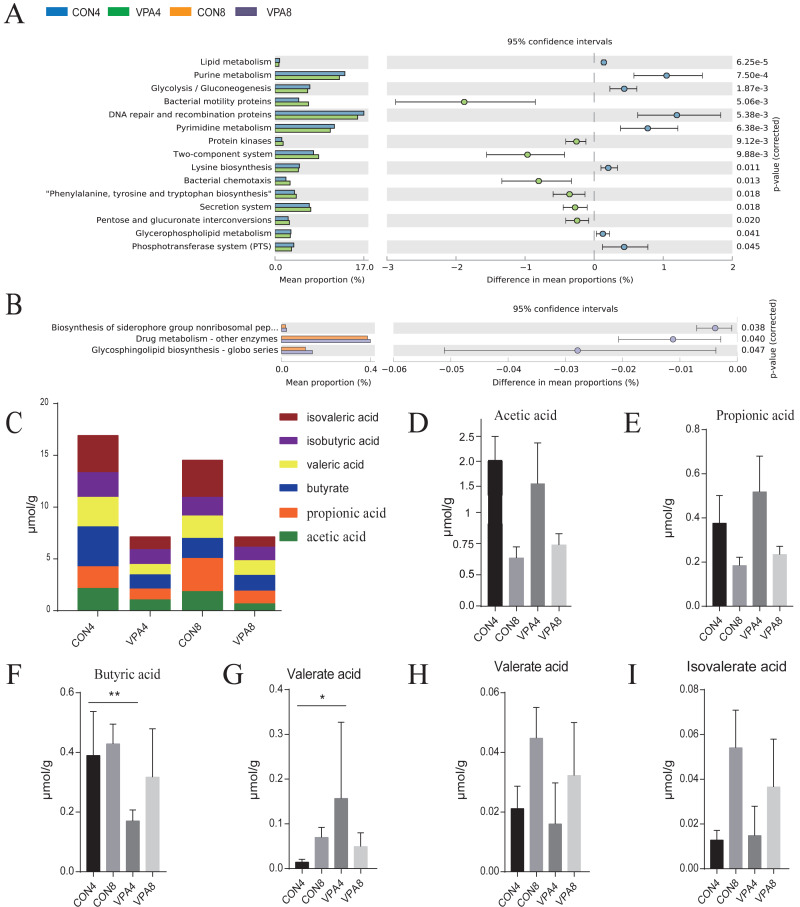
Figure 6. The prediction of metagenome function by PICRUST and SCFA analysis.
(A) Differential KEGG pathways between 4- and 8-week-old rats were evaluated using a two-sided Welch’s t-test at p < 0.05. (B) Heat map of SCFAs. (C–H) The levels of acetic acid, propionic acid, butyric acid, valeric acid, isobutyric acid and isovaleric acid from weaning to sexual maturation. Data represent mean with 95% CI. One-way ANOVA followed by Fisher’s LSD multiple-comparison test: *(p < 0.05); **(p < 0.01); ***(p < 0.001); ****(p < 0.0001).

