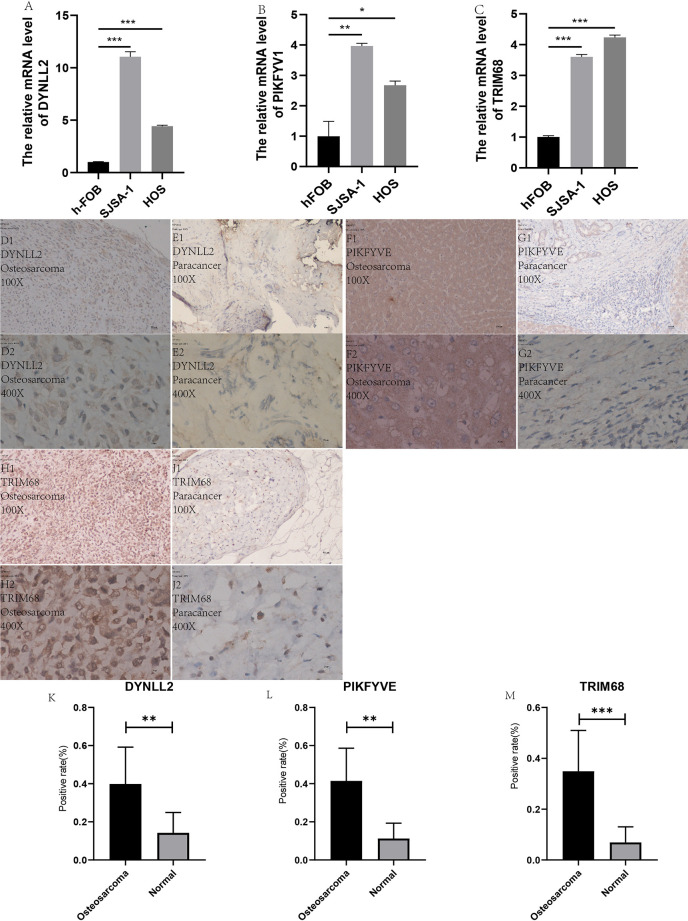
Figure 12.
qRT-PCR and immunohistology. (A–C) plots show the expression of these three genes in two types of osteosarcoma cells as well as in normal control cells, respectively. (D1–J2) plots demonstrate the expression of these three genes in osteosarcoma and paraneoplastic tissues (guide inverted microscopy 100×). The (K–M) plots represent the statistics of the positivity rate of these three genes in pathological sections, respectively. (J) has been used to number the immunohistochemically stained images. “*” represents P < 0.05, “**” represents P < 0.01, “***” represents P < 0.001.

