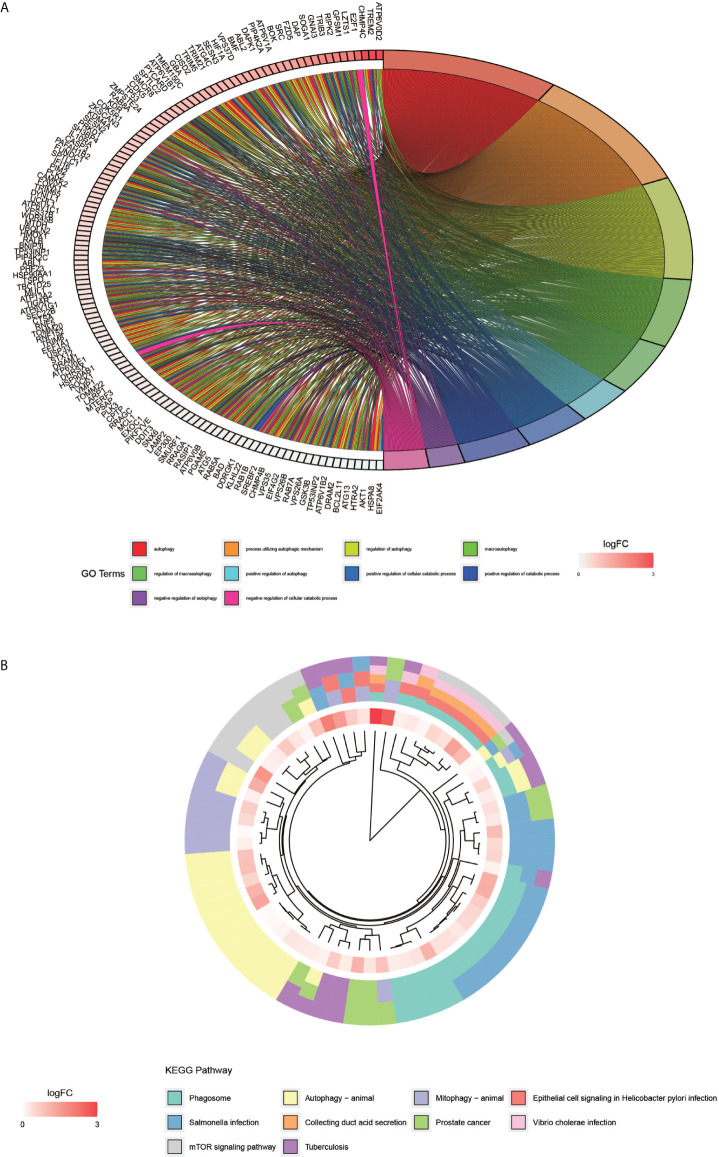
Figure 3.
GO enrichment analysis of autophagy-related genes and KEGG pathway enrichment analysis. (A) graph shows the GO enrichment analysis of autophagy-related genes. The different color modules on the right side of the graph represent different GO entries; the left side represents genes, and the shades of red indicate the magnitude of the logFC values. (B), showing the first ten entries of KEGG. The different color modules represent different KEGG pathways. The innermost color indicates the size of the logFC value of the gene.

