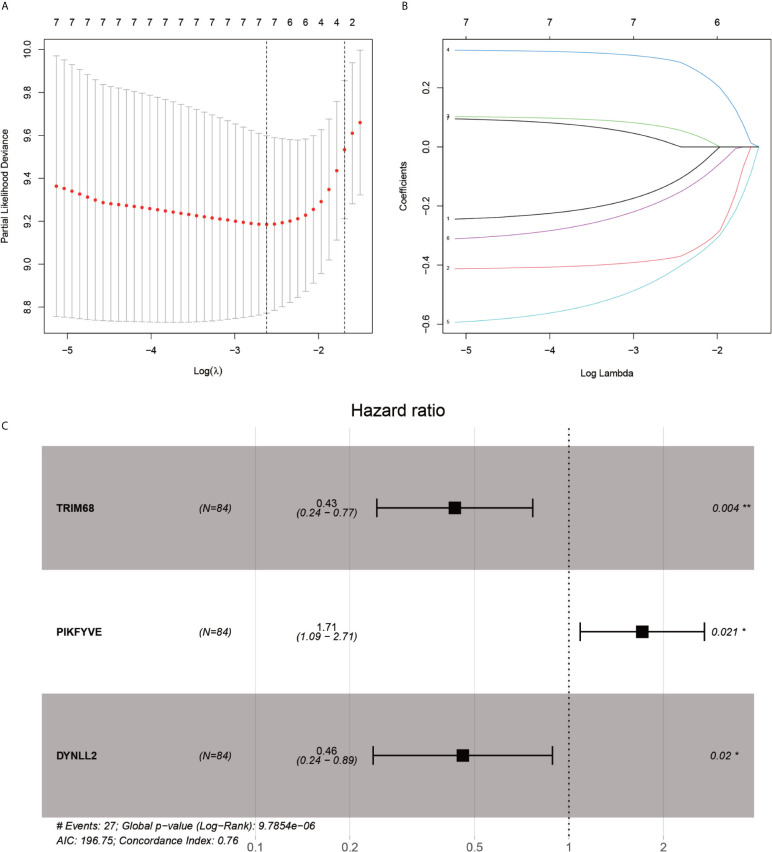
Figure 4.
LASSO regression and multivariate COX regression analysis graph. (A), Tenfold cross-validation of LASSO regression model adjustment parameter selection. (B), LASSO coefficient curves for the seven analyzed genes included in the analysis. (C), forest plot of multifactorial Cox regression analysis. P-value < 0.05 from multifactorial Cox regression analysis of TRIM68, PIKFYVE and DYNLL2. “*” represents P < 0.05, “**” represents P < 0.01.

